
Diwali Picks Report
Diwali Special - November 2021
Research Team | www.angelone.in

Diwali
Happy
Dear Friends,
Let me wish you all a very Happy Diwali and a Prosperous New Year!
As we head into the auspicious occasion of Diwali, the Nifty continues to hit new lifetime highs and even the
second Covid wave in Q1FY2022 did not have any significant impact on the markets. While the second Covid wave
briefly interrupted the recovery process, the impact was smaller than the first wave and high-frequency
indicators already point to a V-shaped recovery in the economy.
Markets were also supported by continued monetary and fiscal stimulus in developed economies. This resulted in
large FII flows into emerging markets including India as we received record flows of `2.7 lakh Cr in FY2021
including `2 lakh Cr in H2FY2021. While FII flows were robust last year, mutual funds witnessed outflows of
`39,327Cr.
However, the mutual fund outflows were compensated by an increase in direct retail participation. This was
reflected in 2.9Cr new demat account additions between Mar ’20 and Sep ’21 and has led to an increase in demat
penetration from 3.1% to 5.1%. I expect direct retail participation to increase significantly in the years to come
driven by new-age digital brokers like us who are leveraging technology to penetrate previously un-served
markets of Tier-II cities and beyond.
The US Fed in its latest FOMC meeting has announced that it will start with the tapering of bond purchases from
the end of 2021. This is leading to concerns that we may see FII outflows which will lead to a correction in the
markets like 2013. However, this time around India’s fundamentals are much better as compared to 2013 and
therefore it is unlikely that there will be any major pullout by FIIs though there will be a slowdown in inflows.
While we are already witnessing moderation in FII flows as compared to FY2021, mutual fund flows have turned
positive at over `53,325Cr in the first half of FY2022. Going forward I expect mutual fund flows will remain robust
which along with a continued increase in direct retail participation will more than make up for a slowdown in FII
flows and keep driving markets.
What is also giving me confidence is the significant increase in the pace of vaccination over the past few months
with India having achieved the landmark of administering over 100Cr doses. At the current rate, the entire eligible
population will be partially vaccinated by Dec ’21 which will limit the impact of any possible third Covid wave on the
economy. Therefore looking at the current environment I am confident that the economy will continue to improve
from here on and we can look forward to an even brighter Diwali next year.
So, let’s continue the exciting journey while celebrating this auspicious occasion.
Happy Diwali once again!
Dinesh Thakkar
CMD, Angel One Limited

Strong economic recovery to support markets
The Indian economy has rebounded strongly post the second Covid wave with high-
frequency indicators pointing to a V-shaped recovery to pre-second wave levels. While
manufacturing had led in the initial phase of the rebound, gradual withdrawal in
restrictions has led to a strong rebound in the services sector since Aug '21. We expect
the economic recovery process to continue led by strong festive demand and continued
acceleration in the services sector. Significant progress on the vaccination front will
restrict the fallout from any possible third Covid wave. Going ahead, we expect banking
and consumer-facing sectors to drive the markets given an expected rebound in
earnings in H2FY2022. We also remain positive on the IT sector given the structural
up-shift in the medium-term growth trajectory for the sector. Although on a P/E basis the
Nifty is trading above its five-year average, ex of IT and RIL, the Nifty is still near its
five-year average which provides comfort.
Improvement in Covid situation and progress on vaccination are key
positives
The Covid situation in India has improved significantly as the new cases on a 7-day rolling
average are now at ~15,000 per day from the peak of ~4 lakh per day in May '21 despite the
withdrawal of restrictions. Significant progress has been made on the vaccination front
with over 75% of the eligible population being partially vaccinated. Going by the current
pace of vaccination it is estimated that the entire eligible population will be fully vaccinated
by the end of Dec ‘21 which will limit the impact of any possible third wave on the economy.
Domestic flows to make up for any slowdown in FII flows due to tapering
Given the strong rebound in the US economy and high level of inflation due to supply chain
issues, the US Fed has indicated that they will start with the tapering gradually from the end
of CY2021. Considering the gradual pace of tapering, it is unlikely that there will be any
major pullout by FIIs though there will be a slowdown in inflows. However robust mutual
fund flows along with a continued increase in direct retail participation will more than make
up for a slowdown in FII flows.
Banking, consumption, and select cyclical sectors to do well along
with IT
We expect the banking sector to lead the markets from here on given the strong rebound in
earnings in H2FY2022 due to the pick up in AUM growth and decline in provisioning. We also
expect sectors like aviation, consumer durables, hotels, multiplexes, and real estate to do
well on the back of strong earnings growth in H2FY2022 due to further reopening of the
economy and pent-up demand. We expect that the IT sector will also continue to do well
going forward despite significant rerating over the past year due to structural upshift in the
medium-term growth trajectory.
Key risks for the markets are 1) A bigger than expected third Covid wave in India which
impacts the recovery process 2) Further increase in global inflation from current levels
forcing central banks to tighten earlier than expected.
Company CMP (`) TP (`)
Auto
Ashok Leyland 143 175
Sona BLW Precis. 640 775
Ramkrishna Forg. 1,192 1,545
Suprajit Engg. 368 425
Banking
AU Small Finance 1,261 1,520
Federal Bank 102 135
HDFC Bank 1,653 1,859
Shri.City Union. 2,215 3,002
Chemical
P I Industries 3,000 3,950
Others
Carborundum Uni. 868 1,010
Stove Kraft 980 1,288
Safari Inds. 853 979
Sobha 765 950
Whirlpool India 2,230 2,760
Lemon Tree Hotel 53 64
Amber Enterp. 3,450 4,150
Source: Company, Angel Research
Note: Closing price as on 26th Oct, 2021
Top Picks
Top Picks Report November 2021
Diwali Special
November 2021 2
The Indian economy has staged a V-shaped recovery post-second wave
Since the past Diwali, India's recovery was set back by a quarter owing to the second wave
during Q1FY2022. However, the recovery was equally fast with the Indian economy staging
a V-shaped recovery. The mobility trends are reverting to pre-covid levels as per the google
mobility index where the retail & recreation indicator has reached 96% of baseline level,
public transport is up 3% from the baseline and the workplaces indicator suggests that the
“back to the office” theme is picking up.
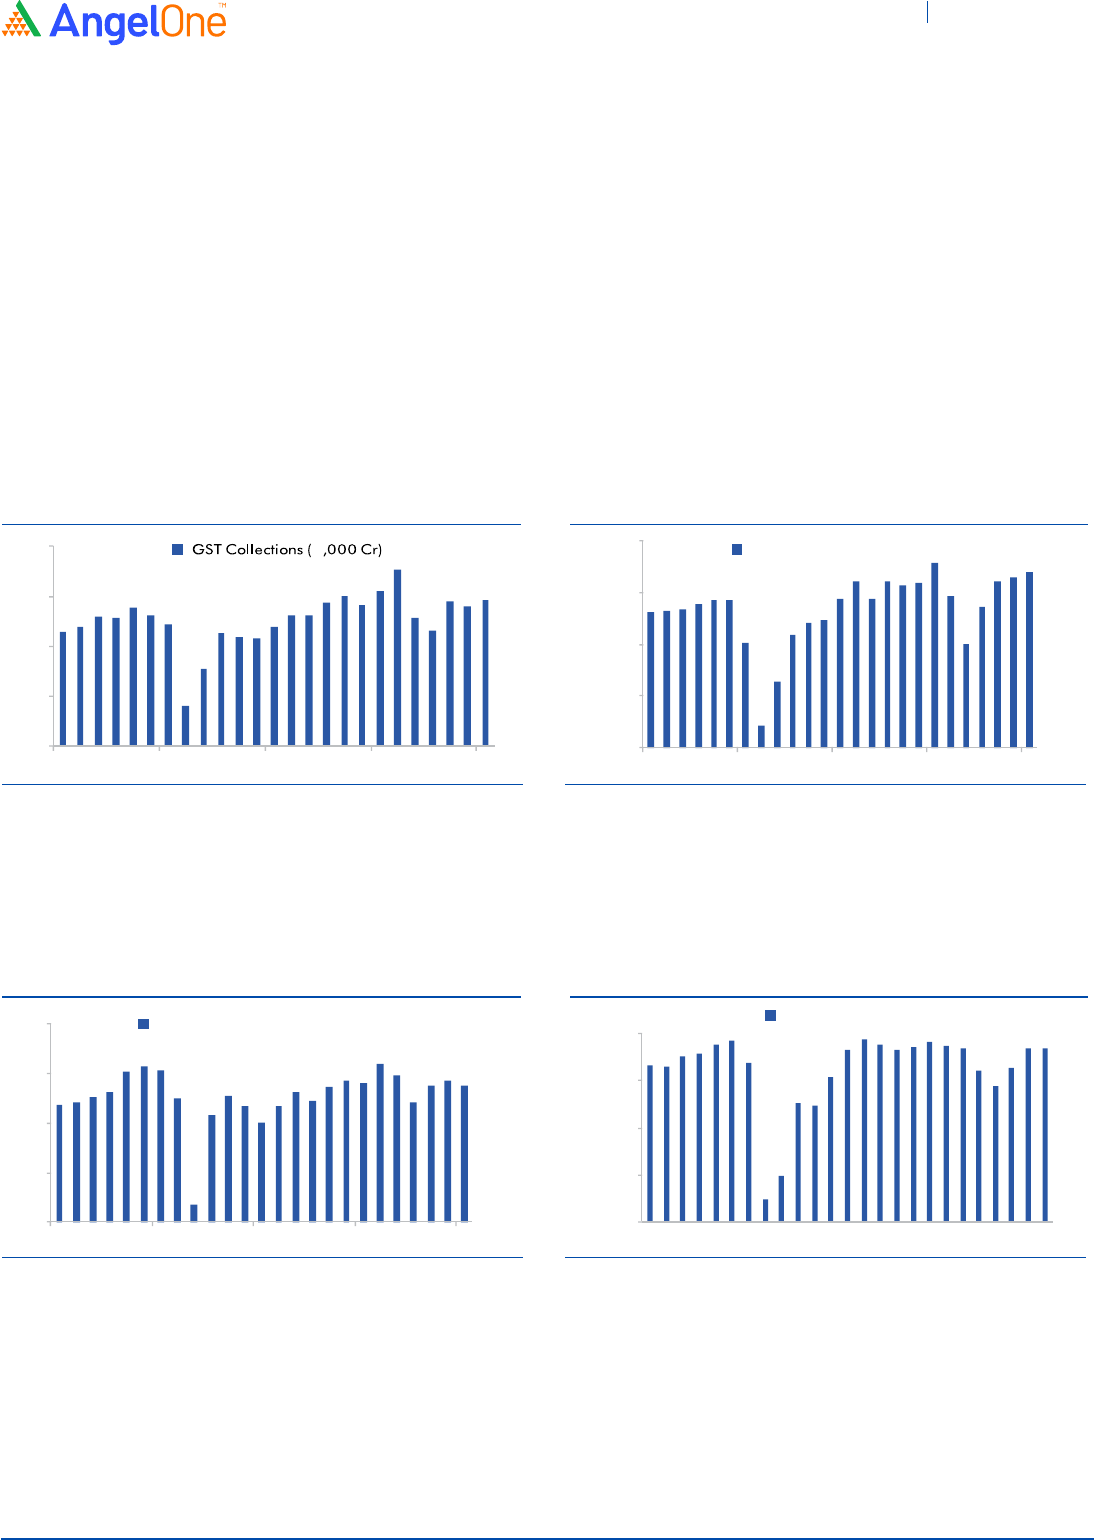
As for other leading indicators, the GST collections have also rebounded post the second
lockdown and are now above the pre-pandemic levels of 2019. E-Way bill generation has
been at the highest level since the start of FY2022 and the momentum is likely to pick up
which will get reflected in GST numbers to come.
High frequency indicators like GST and
E-Way bills are above pre pandemic levels
Exhibit 1: GST Collections above pre-pandemic levels
Source: GST Council, Angel Research
Exhibit 2: Sep E-way Bill Generation highest for FY22
Source: GSTN, Angel Research
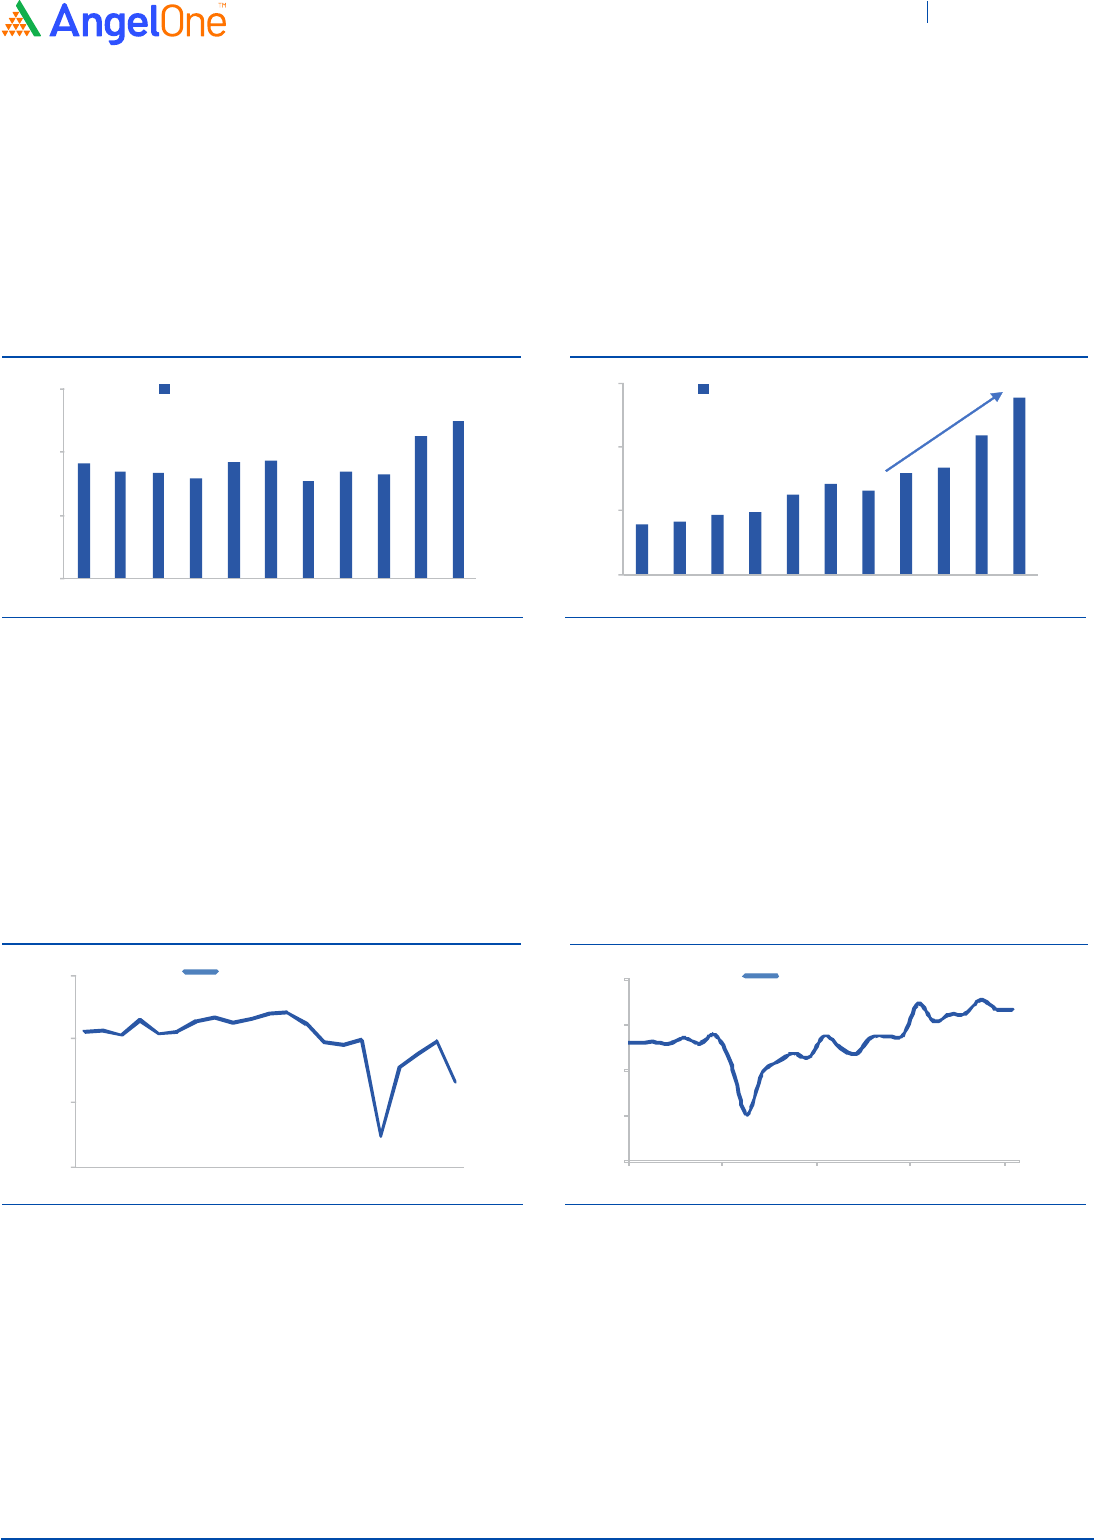
Cement demand is expected to bounce back strongly post the monsoon months led by
higher government spending on infra projects and other construction activity. The PMI
numbers also point to a very strong recovery from the second wave lows in Q1FY2022.
Exhibit 3: Recent volumes higher than 2019 levels
Source: Bloomberg, MOSPI, Angel Research
Exhibit 4: PMI points to strong recovery from 2nd wave
Source: IHS Markit, Angel Research
92
95
117
0
40
80
120
160
₹
52
57
68
0
20
40
60
80
Sep-19 Mar-20 Sep-20 Mar-21 Sep-21
E-way Bill Generation (Mns)
23.6
3.5
20.1
27.6
0
10
20
30
40
Aug-19 Feb-20 Aug-20 Feb-21 Aug-21
Cement Production (Mn Tonnes)
49.8
7.2
54.6
43.1
55.3
0
15
30
45
60
Sep-19 Mar-20 Sep-20 Mar-21 Sep-21
India Composite PMI
Top Picks Report November 2021
Diwali Special
November 2021 3
Sep-19 Mar-20 Sep-20 Mar-21 Sep-21
As for investing for future growth, the intent is visible from Government's Capex figures.
Central Government's Capital Expenditure as a percentage of Nominal GDP has improved
from 1.5% in FY2018 to 2.5% of FY2022 budgeted Estimates. Private sector Capex in
cement and steel sectors is already visible owing to strong demand and improving
profitability. Additionally, the PLI scheme is expected to boost private sector participation
where the environment is conducive with ample liquidity and low-interest rates.
Increase in Government Capex will
also help drive GDP growth over the
long run
Exhibit 5: Increased Govt. allocation to Capex…
Source: Budget Documents, RBI, Angel Research
Exhibit 6: …is also meaningful in absolute terms
Source: Budget Documents, RBI, Angel Research
Near-term threats are emerging from rising inflation and tapering by the US Fed. The pace
of inflation has been alarming due to global supply chain bottlenecks and a rise in input and
energy prices but the same is expected to cool off by Q4FY2022. As far as India is
concerned, the OBICUS survey suggests that the capacity utilizations have enough
headroom to improve to meet the broad-based improvement in demand which in turn
should help mitigate the impact on gross margins for corporate India due to higher input
costs.
Exhibit 7: CUs low; can address any uptick in demand
Source: RBI OBICUS Survey, Angel Research
Exhibit 8: Exports can become a growth driver for India
Source: GOI, Angel Research
Additionally, given the supply side and other issues faced by China, India is in a good
position to act as a substitute player and can benefit from the buoyant global demand
scenario. We therefore believe that Exports will be another growth engine for India going
forward.
1.8
1.5
2.5
0
1
2
3
FY12 FY14 FY16 FY18 FY20 FY22E
Capital Expenditure % of GDP
1.6
2.6
5.5
0
2
4
6
FY12 FY14 FY16 FY18 FY20 FY22E
Capital Expenditure (`Lk Cr.)
20% CAGR
76.1
69.4
60.0
40
55
70
85
Jun-16 Jun-17 Jun-18 Jun-19 Jun-20 Jun-21
Capacity Utilisation (%)
27.7
33.4
0
10
20
30
40
Sep-19 Mar -20 Sep-20 Mar -21 Sep-21
Exports (USD Bn)
Top Picks Report November 2021
Diwali Special
November 2021 4
Decrease in new cases, lower positivity rates, and progress on
vaccination will help to fully open up the economy
The covid situation in India has improved significantly over the last three months. From the
peak of ~4 lakh per day cases as seen during the peak of the second wave in May '21, the new
cases on a 7-day rolling average came down to ~24,000 by the end of Sep'21 and are now
averaging ~15,000 per day.
Although the contribution of key states like Maharashtra, Kerala, Tamil Nadu, Karnataka,
and Andhra Pradesh (AP) makes up for most of the new cases, the active cases in
Maharashtra, Karnataka, and AP continues to decline. More importantly, the positivity
rates have come down significantly in these states and India's overall positivity rate at 1.3%
is below pre-second wave levels while the 15 day lag Mortality rate is currently at less
than 2%.
Positivity rate at 1.3% is below
pre second wave levels of 1.6%
Exhibit 9: Decline in new cases despite unlocking
Source: GOI, Angel Research
Exhibit 10: Positivity rates are lower than Feb'21 levels
Source: GOI, Angel Research
While India was slow to start with the vaccination process there has been a significant step
up in the pace of vaccination since August as a result of which 51.2%/75% of the
total/eligible population has already received one dose as of 23rd of Oct'21. At the current
pace, India is expected to partially vaccinate its entire eligible population by Dec'21 which
would mitigate the impact of any possible third wave.
Significant progress on vaccination
reduces the risk of a third wave
Exhibit 11: Over half of India's population has been partially vaccinated
Source: GOI, Angel Research
0
1
2
3
4
Jan-21 Feb-21 Apr-21 May -21 Jun-21 Aug-21 Sep-21
7 Day rolling new cases (Lakhs)
1.6
22.7
1.3
0
8
16
24
Jan-21 Feb-21 Apr-21 May -21 Jun-21 Aug-21 Sep-21
Positivity Rate (%)
51.2
21.4
0
10
20
30
40
50
60
Jan-21 Feb-21 Apr-21 May -21 Jun-21 Aug-21 Sep-21
Partial Vaccination (%) Full Vaccination (%)
Top Picks Report November 2021
Diwali Special
November 2021 5
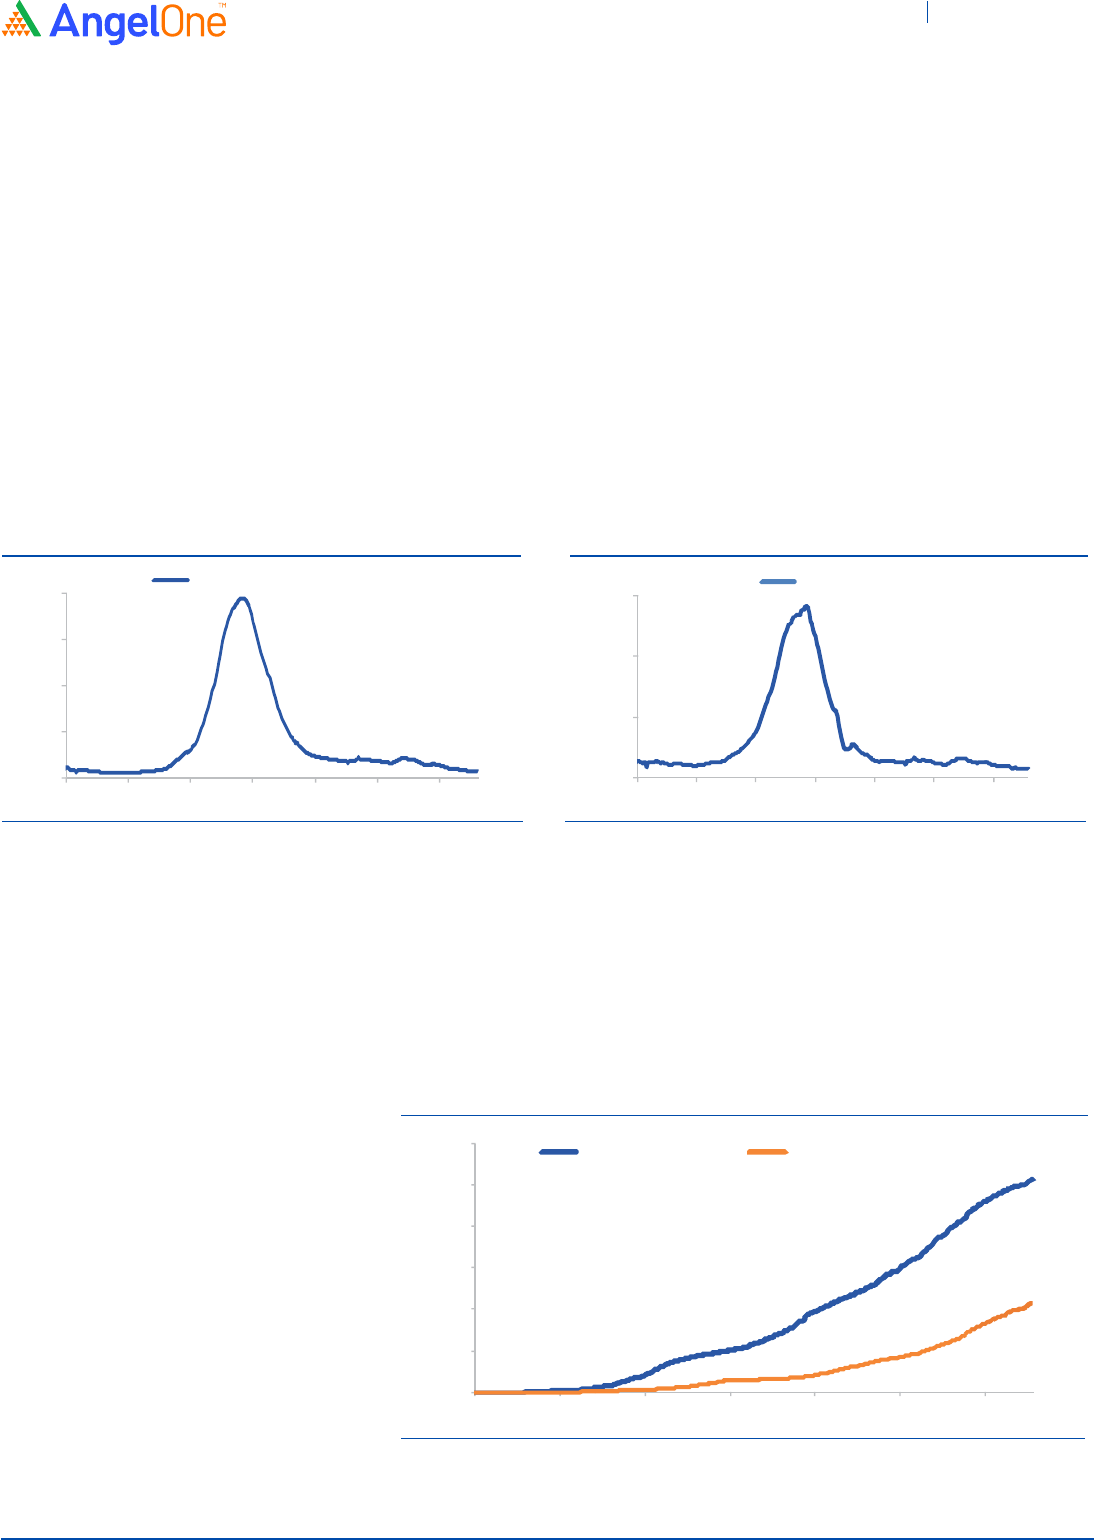
Strong US growth & high inflation trigger tapering by the US Fed
With restrictions being eased at the start of the calendar year, the US economy has seen its
sharpest rebound thanks to the USD1.9 trillion stimulus package in Mar '21. This led to a
sharp increase in demand for goods while services rebound started with the easing of
norms. As a result, the US GDP has now recovered to pre-pandemic levels led by
consumption.
US economy has rebounded to
pre pandemic levels led by consumption
Exhibit 12: US GDP is back to pre Covid levels
Source: Bloomberg, FED, Angel Research
Exhibit 13: Driven by strong consumption growth
Source: Bloomberg, FRED, Angel Research
An increase in private wages and factors like Child Tax Credit payments starting in Jul'21
have also boosted income levels. As a result, Personal Consumption Expenditure has
sustained at recent highs which is reflected in the retail sales numbers; up ~16% higher
than the pre-Covid levels. Based on the current trends, the retail sales are showing
resilience but some of the rise in retail spending is also attributed to inflation.
Exhibit 14: Retail Sales continue to remain strong
Source: Bloomberg, Angel Research
Exhibit 15: Inflation at highest levels in last 13 years
Source: US BLS, Angel Research
It is evident that the US growth has bounced back strongly, and the demand is expected to
sustain. This along with the effects of higher energy price and supply chain related issues
have lifted inflation to its highest levels seen in the past 13 years. Given the high growth
rates and inflation, the US fed has indicated that they will start with the tapering of their
bond purchases from the end of 2021.
2.1
3.1
2.3 2.2
2.1
2.3
2.6
0.6
-9.1
-2.9
-2.3
0.5
12.2
-15
-10
-5
0
5
10
15
Jun-18 Dec-18 Jun-19 Dec-19 Jun-20 Dec-20 Jun-21
US Qtr GDP Growth YoY (%)
3.1
3.2
2.6
2.1 2.1
2.3 2.3
0.3
-10.2
-2.8
-2.4
2.1
16.2
-15
-10
-5
0
5
10
15
20
Jun-18 Dec-18 Jun-19 Dec-19 Jun-20 Dec-20 Jun-21
US Qtr Consumption Growth YoY (%)
4.0
6.0
53.4
13.9
-40
-20
0
20
40
60
Sep-19 Mar -20 Sep-20 Mar -21 Sep-21
US Retail sales growth YoY (%)
0.1
1.4
5.4
0
2
4
6
May -20 Sep-20 Jan-21 May -21 Sep-21
US CPI YoY (%)
Top Picks Report November 2021
Diwali Special
November 2021 6
However, tapering will be gradual and unlikely to disrupt markets
The minutes of the Oct Fed meeting indicate that the US Fed is most likely to announce the
start of the tapering in the Nov '21 FOMC meeting given the continued high level of inflation
and strong consumer demand.
This is leading to concerns that we are likely to see a repeat of 2013 when talks of tapering
led to a correction in Indian markets. However, the correction in Indian equities in 2013 was
more due to the twin balance sheet problem in India along with very high levels of Inflation.
India had a current account deficit of 4.8% in FY13 while CPI inflation too was well over 10%.
However, this time around India's fundamentals are much better as compared to FY13 as
we had a current account surplus of 0.9% in FY2021 as compared to a large deficit in
FY2013. Inflation is also significantly lower and has been below the 6.0% levels as
compared to double-digit inflation in 2013.
The US fed likely to announce
tapering in the Nov'21 FOMC meet
India's external situation is significantly
better as compared to 2013
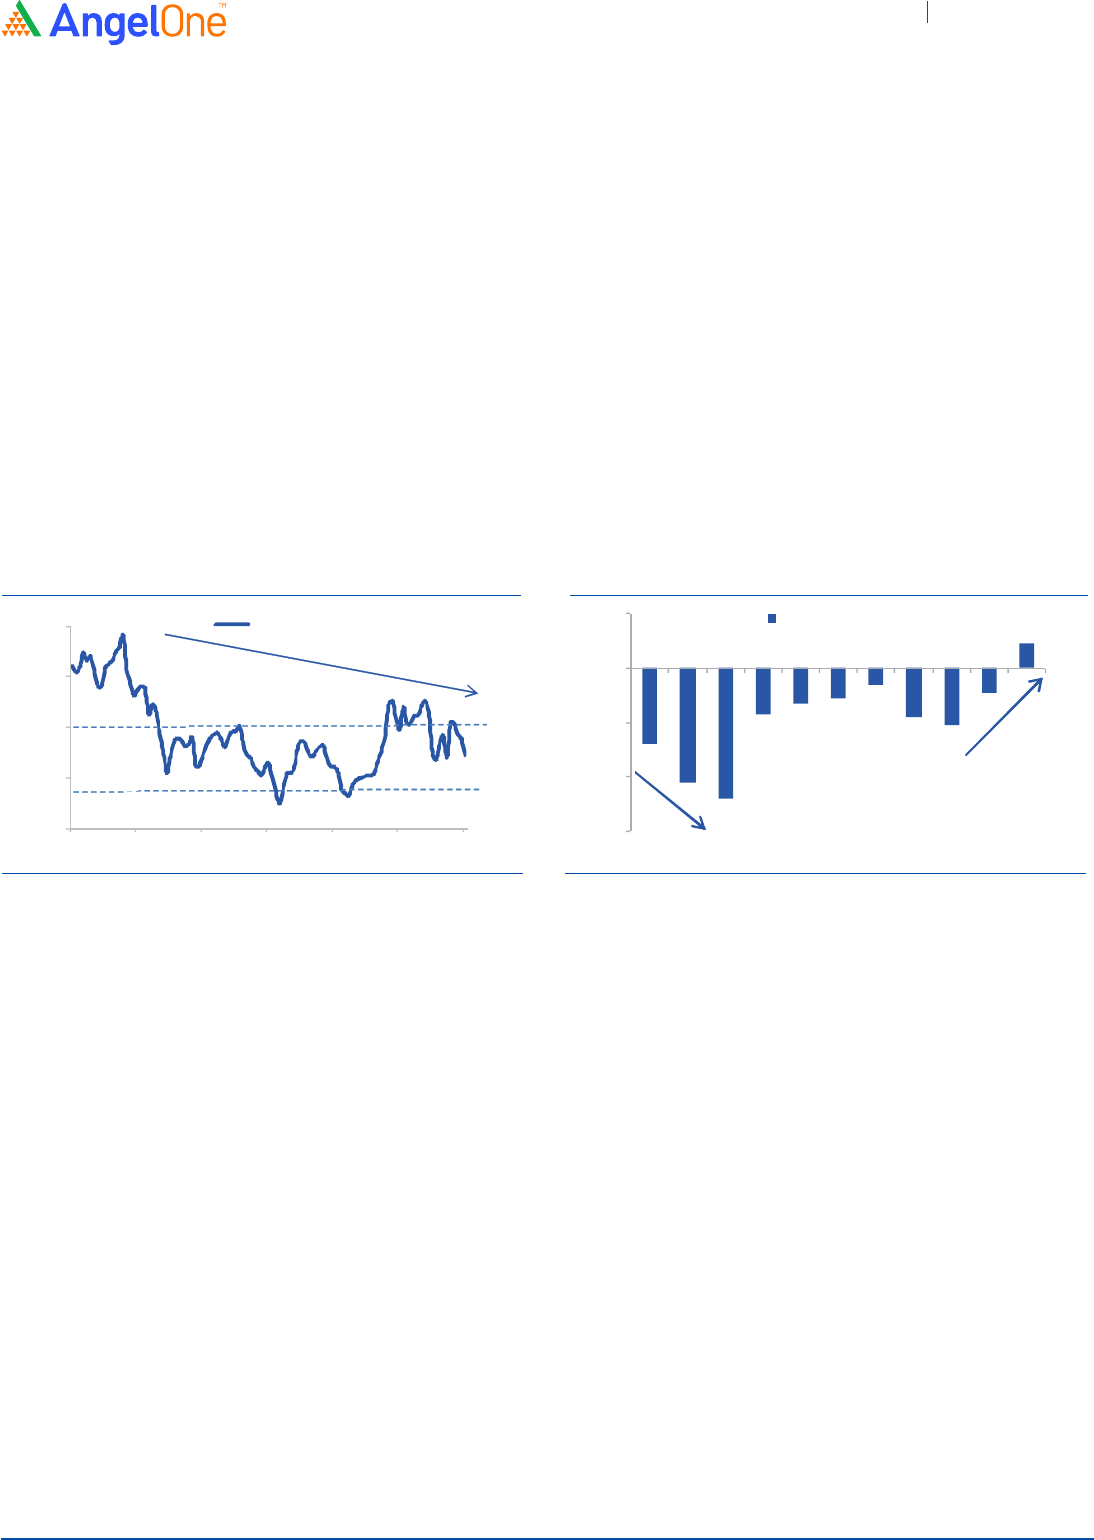
Exhibit 16: India Inflation has come down structurally
Source: Angel Research, Bloomberg, RBI
Exhibit 17: First CAD surplus for India in 17 years
Source: Angel Research, Bloomberg, RBI
Given the significant improvement in external position, we believe that India is in a much
better position to withstand any external shock arising from tapering as compared to 2013.
Moreover, the Fed has indicated that they will taper gradually and reduce their bond
purchases by USD 15bn from current levels of USD 120bn per month. The Fed has also
indicated that rate hikes are only going to start happening from the second half of the
calendar year 2022 once the tapering process is over.
Therefore, the tightening process is going to be a gradual one and will allow the markets to
get accustomed to lower liquidity gradually thus ensuring that there is no abrupt sell-off in
global markets. Hence global liquidity is expected to remain reasonably strong in FY2022
and will ensure that we keep getting some amount of FII flows for the rest of FY2022.
Gradual tapering will allow markets
to get accustomed to lower liquidity
11.5
4.4
0
3
6
9
12
Sep-12 Mar -14 Sep-15 Mar -17 Sep-18 Mar -20 Sep-21
CPI Inflation (%)
-2.8
-4.2
-4.8
-1.7
-1.3
-1.1
-0.6
-1.8
-2.1
-0.9
0.9
-6
-4
-2
0
2
FY11 FY13 FY15 FY17 FY19 FY21
CAD (% of GDP)
Top Picks Report November 2021
Diwali Special
November 2021 7
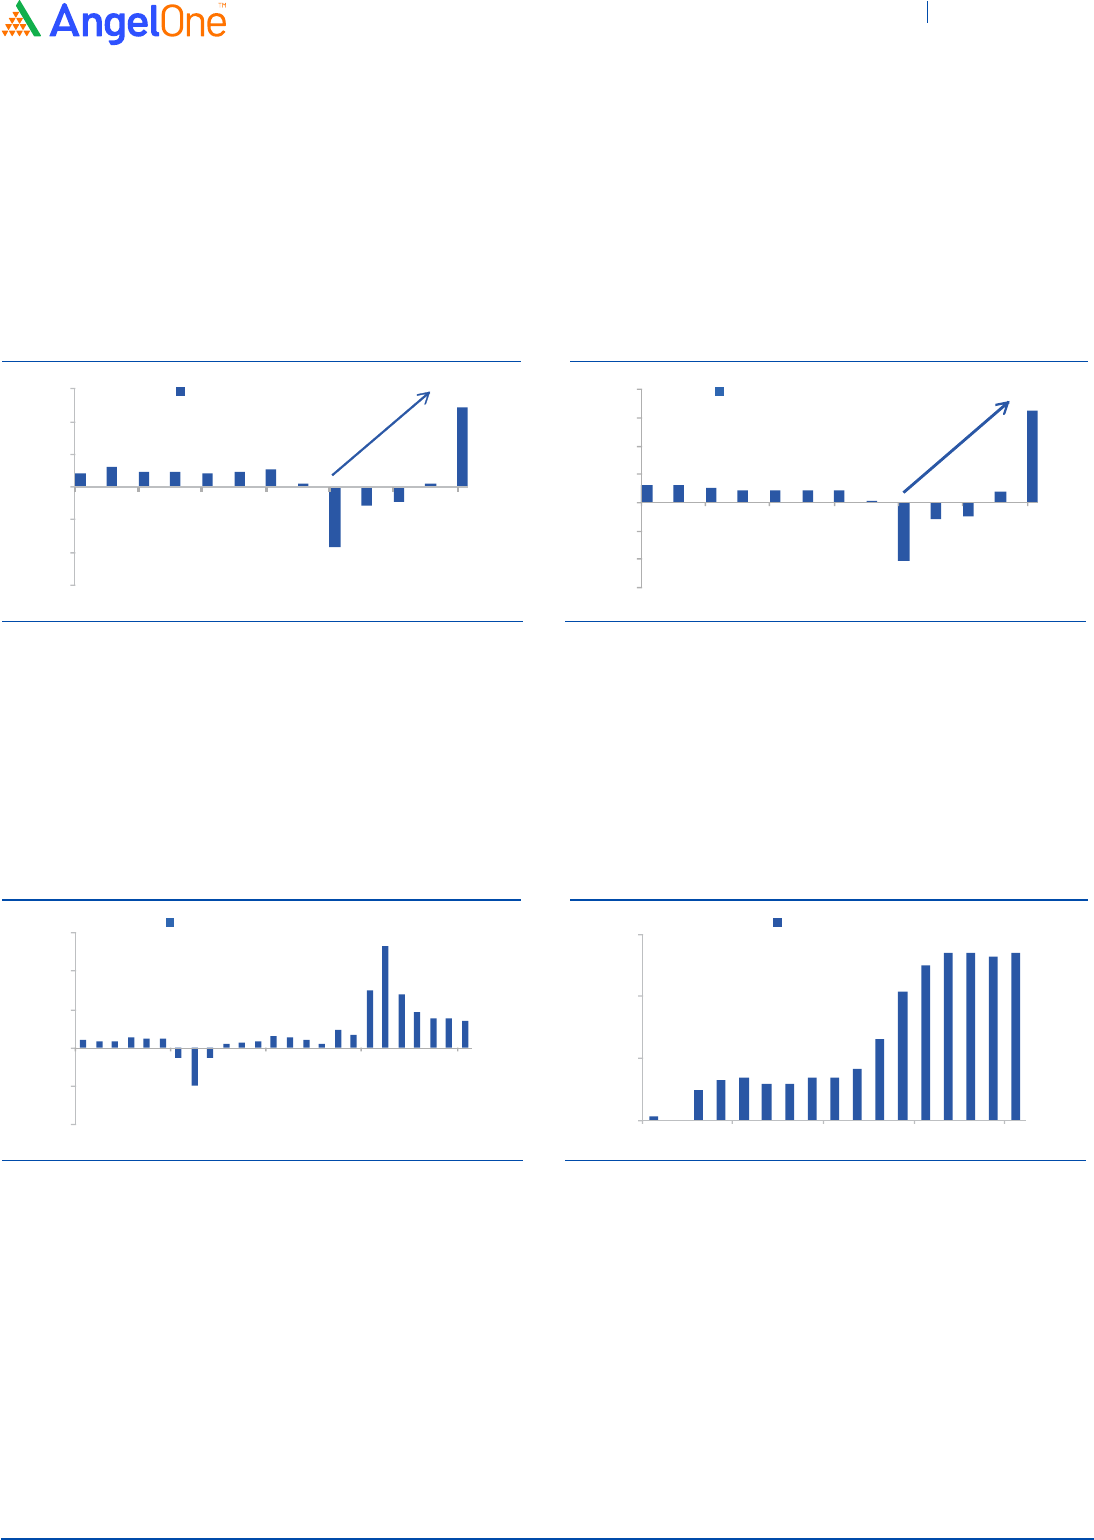
Domestic liquidity will make up for any slowdown in FII flows
While we expect FII flows to be stable for the rest of FY2022 and moderate from the
`2.7 lakh Cr. inflows in FY2021 we expect domestic flows will be robust. Mutual fund flows
that had turned negative in FY2021 have bounced back strongly in the first half of FY2022.
We expect Mutual fund flows to remain strong going forward which will make up for any
possible slowdown in FII flows.
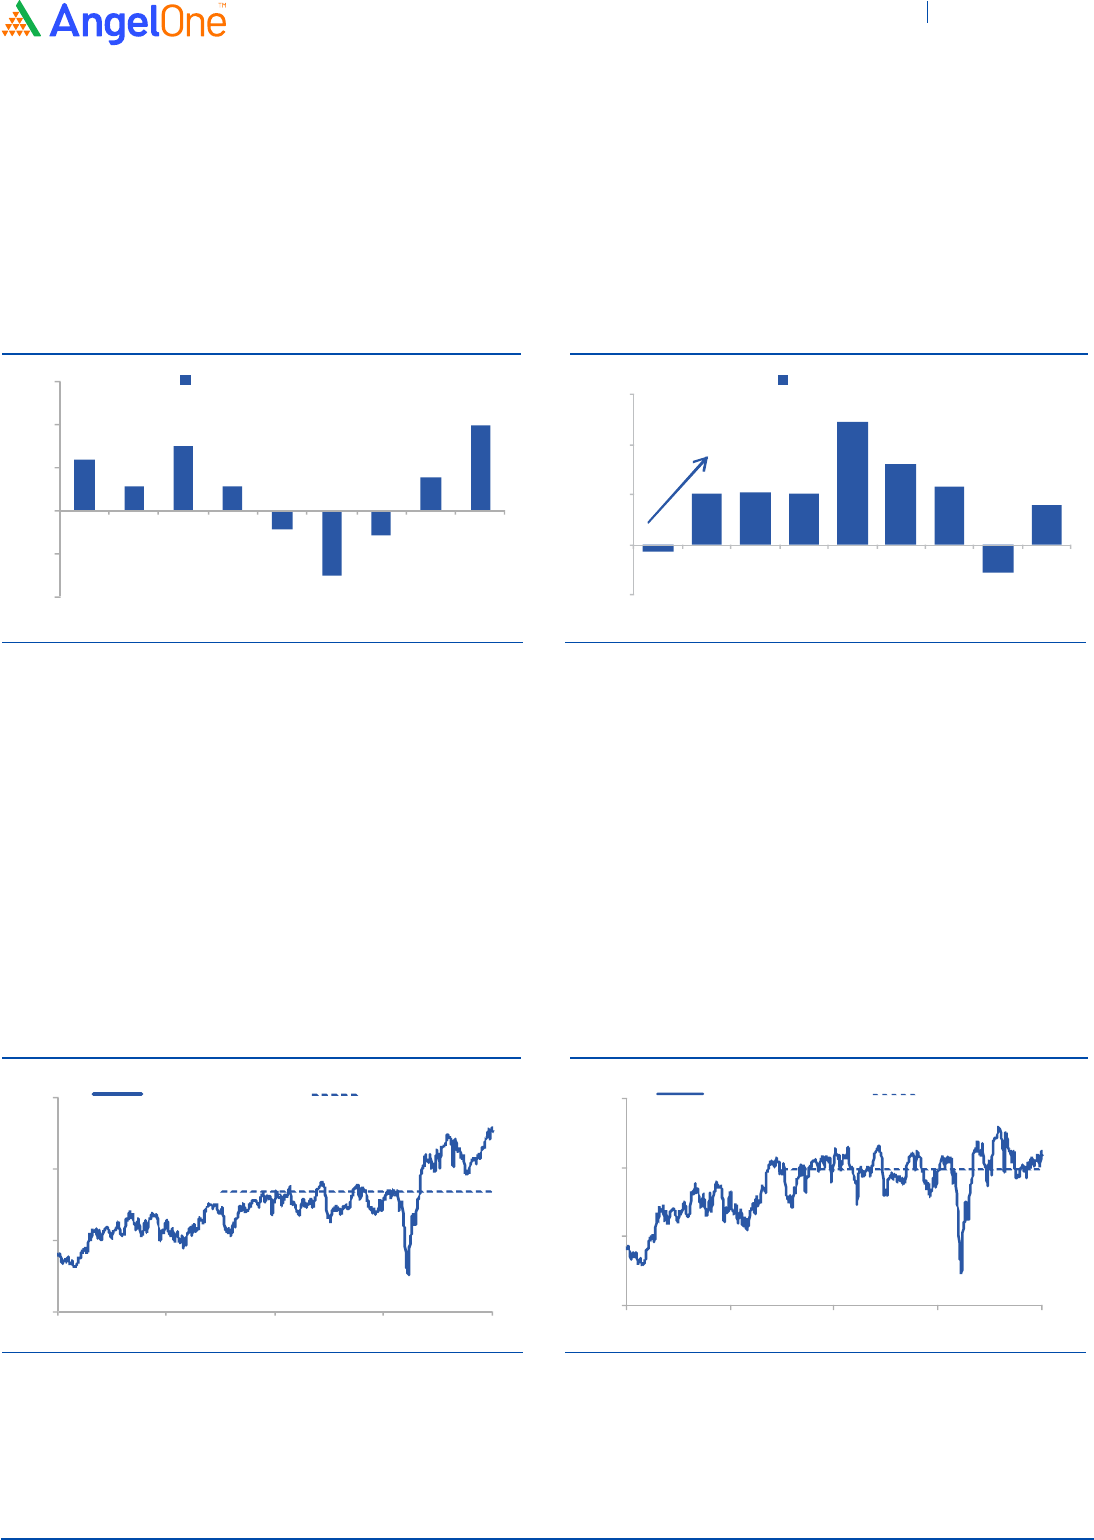
Mutual Fund flows have turned
positive in 1HFY2022
Exhibit 18: MF flows have turned positive in 1HY22
Source: Angel Research, AMFI, SEBI
Exhibit 19: MF Flows to drive markets going forward
Source: Angel Research, AMFI, SEBI
Valuations optically higher due to rerating in few sectors and low
corporate profit to GDP ratio
At current levels, the Nifty is trading at a P/E multiple of 22.7x on rolling one-year
consensus earnings which is well above the past five-year average of 18.4x. This is largely
on account of sharp rerating in the IT sector and Reliance Industries which have a
combined weight of ~28% in the Nifty.
The IT sector and RIL have witnessed a rerating over the past year due to structural
changes in underlying fundamentals which will put them on a higher growth trajectory in
the medium term.
Exhibit 20: Nifty trading at premium to 5 year average
Source: Angel Research, Bloomberg
Exhibit 21: Nifty Ex IT & RIL is still inexpensive
Source: Angel Research, Bloomberg
23.7
11.4
30.1
11.4
(8.9)
(30.1)
(11.7)
15.6
39.7
(40)
(20)
0
20
40
60
Q2FY20 Q4FY20 Q2FY21 Q4FY21 Q2FY22
Mf Flows ( `,000 Cr)
(9)
71
74
70
171
112
82
(39)
55
(70)
0
70
140
210
FY14 FY16 FY18 FY20 1HFY22
Mf Flows (`,000 Cr)
22.7
18.4
10
15
20
25
Oct -13 Oct -15 Oct -17 Oct -19 Oct -21
Nifty one year Fwd P/E 5 year avg.
14.5
13.9
8
11
14
17
Oct-13 Oct -15 Oct -17 Oct -19 Oct -21
Nifty P/E ex IT and RIL 5 year avg
Top Picks Report November 2021
Diwali Special
November 2021 8
Excluding RIL and the IT sector, the Nifty is trading at a P/E multiple of 14.7x. This is near its
last 5-year historical average of 13.9x, which looks reasonable and provides comfort.
Therefore we believe that the Nifty will continue to trade at a premium to historical
averages.
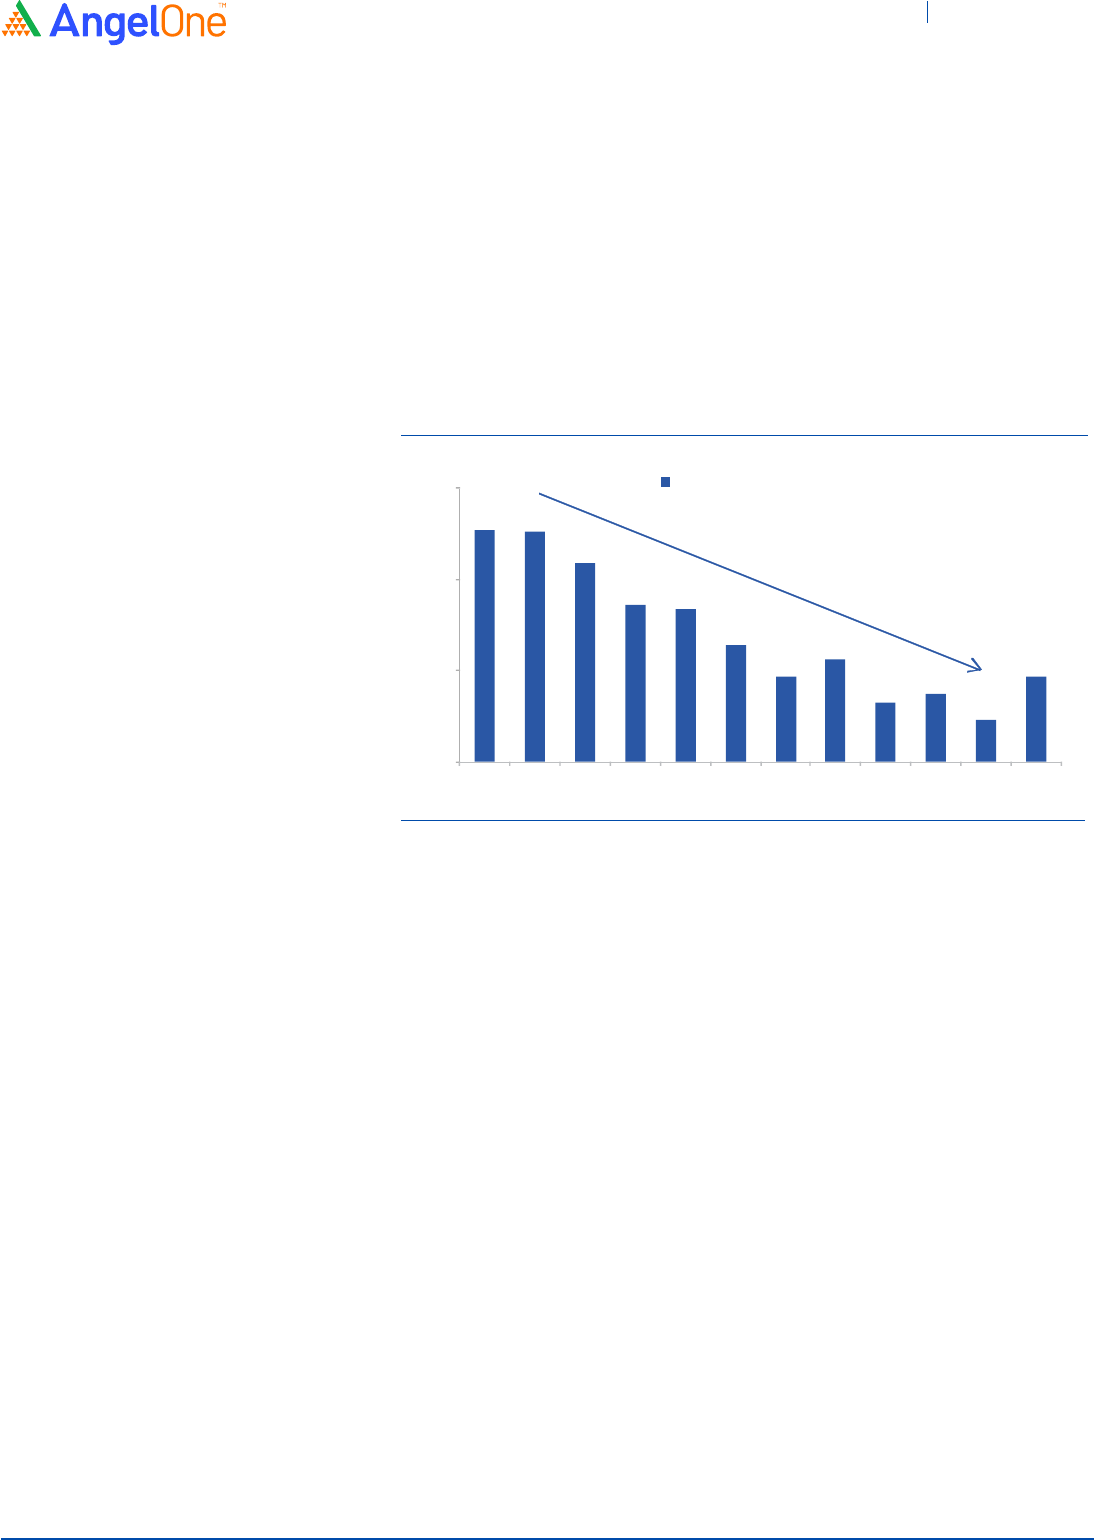
Another reason why the markets appear to be expensive on a P/E basis is due to the
significant drop in corporate profit to GDP ratio between FY10-FY20. India's corporate
profitability growth at 5.8% CAGR during the period was significantly below the nominal
GDP growth of 12.4% CAGR during the same period.
Excluding IT and Reliance Nifty
is still inexpensive
Exhibit 22: Corporate profit to GDP ratio has bottomed out
Source: Angel Research, Bloomberg, Capitaline
While high inflation and interest rates impacted profitability growth between FY10-FY15,
multiple structural reforms like Demonization, GST, RERA, and clean-up of banking sector
NPAs impacted profitability growth between FY15-FY20.
This resulted in corporate profitability to GDP falling from 4.5% in FY2011 to 2.5% in
FY2020. However, with all the reforms related issues behind us, corporate profitability has
started to improve. Profits for BSE 500 companies have grown by 15.4% in FY2021
despite the Covid crisis which has resulted in corporate profit (BSE 500) to GDP ratio
improving to 2.9%.
Strong acceleration in GDP growth over the next 2-3 years along with improving corporate
profitability should lead to a further increase in corporate profit to GDP ratio. Therefore as
earnings growth catches up over the next few years valuations will start to appear more
reasonable.
Earnings growth to catch up
over next 2-3 years
4.5
4.5
4.2
3.7
3.7
3.3
2.9
3.1
2.6
2.7
2.5
2.9
2.0
3.0
4.0
5.0
FY10 FY11 FY12 FY13 FY14 FY15 FY16 FY17 FY18 FY19 FY20 FY21
BSE 500 Profit (% of GDP)
Top Picks Report November 2021
Diwali Special
November 2021 9

Continued economic recovery and liquidity will support markets
The pace of recovery of the Indian economy has surprised everyone with high-frequency
indicators indicating that economic activities are already above the pre-second wave
levels. Festive demand is also expected to be strong which should provide further impetus
to the recovery process.
Inflation is expected to remain below the 6.0% levels well into Q1FY2023 which will allow the
RBI to continue with its accommodative stance. Hence we expect that the RBI will keep the
repo rate at the current 4.0% levels for the rest of FY2022 thus helping the economic
recovery process. Therefore we expect India to achieve 8.5% to 9.5% GDP growth in line
with consensus estimates.
We expect earnings recovery to continue in H2FY2022 led by banking, consumption, and
service oriented sectors due to continued improvement in the underlying economy which
along with strong domestic liquidity will support markets.
Banking, consumption, and select cyclical sectors to do well
along with IT
The Banking sector had been one of the worst impacted sectors due to the second Covid
wave which had led to another round of spike in NPAs and credit costs in Q1FY2022.
However going by the initial trend in the Q2FY2022 results, it seems like the worst is over
for the sector with larger banks reporting improvement in asset quality. We expect a pick-
up in AUM growth along with significant improvement in asset quality and decline in credit
costs in H2FY2022, which should lead to a rerating for the sector.
While we expect the banking sector to lead the markets from here on, we also expect
sectors like aviation, consumer durables, hotels, multiplexes, and real estate will also do
well going forward due to the reopening of the economy and pent up demand. We are also
positive on CVs, cement, and building materials given that they will be the biggest
beneficiaries of the Government's focus on infrastructure and housing.
We also believe that the IT sector will continue to do well going forward despite significant
rerating over the past one year given the structural upshift in growth trajectory over the
next 3-5 years.
Low interest rates to help the
economic recovery process
We expect the banking sector to
post strong growth in H2FY2022
We expect sectors like aviation,
consumer durables, hotels, and
real estate to do well going forward
Top Picks Report November 2021
Diwali Special
November 2021 10

Top Picks Report November 2021
Diwali Special
Diwali Picks
Stock Info
CMP 102
TP 135
Upside 32%
Sector Banking
Market Cap (`cr) 21,867
Beta 1.5
52 Week High / Low 106/50
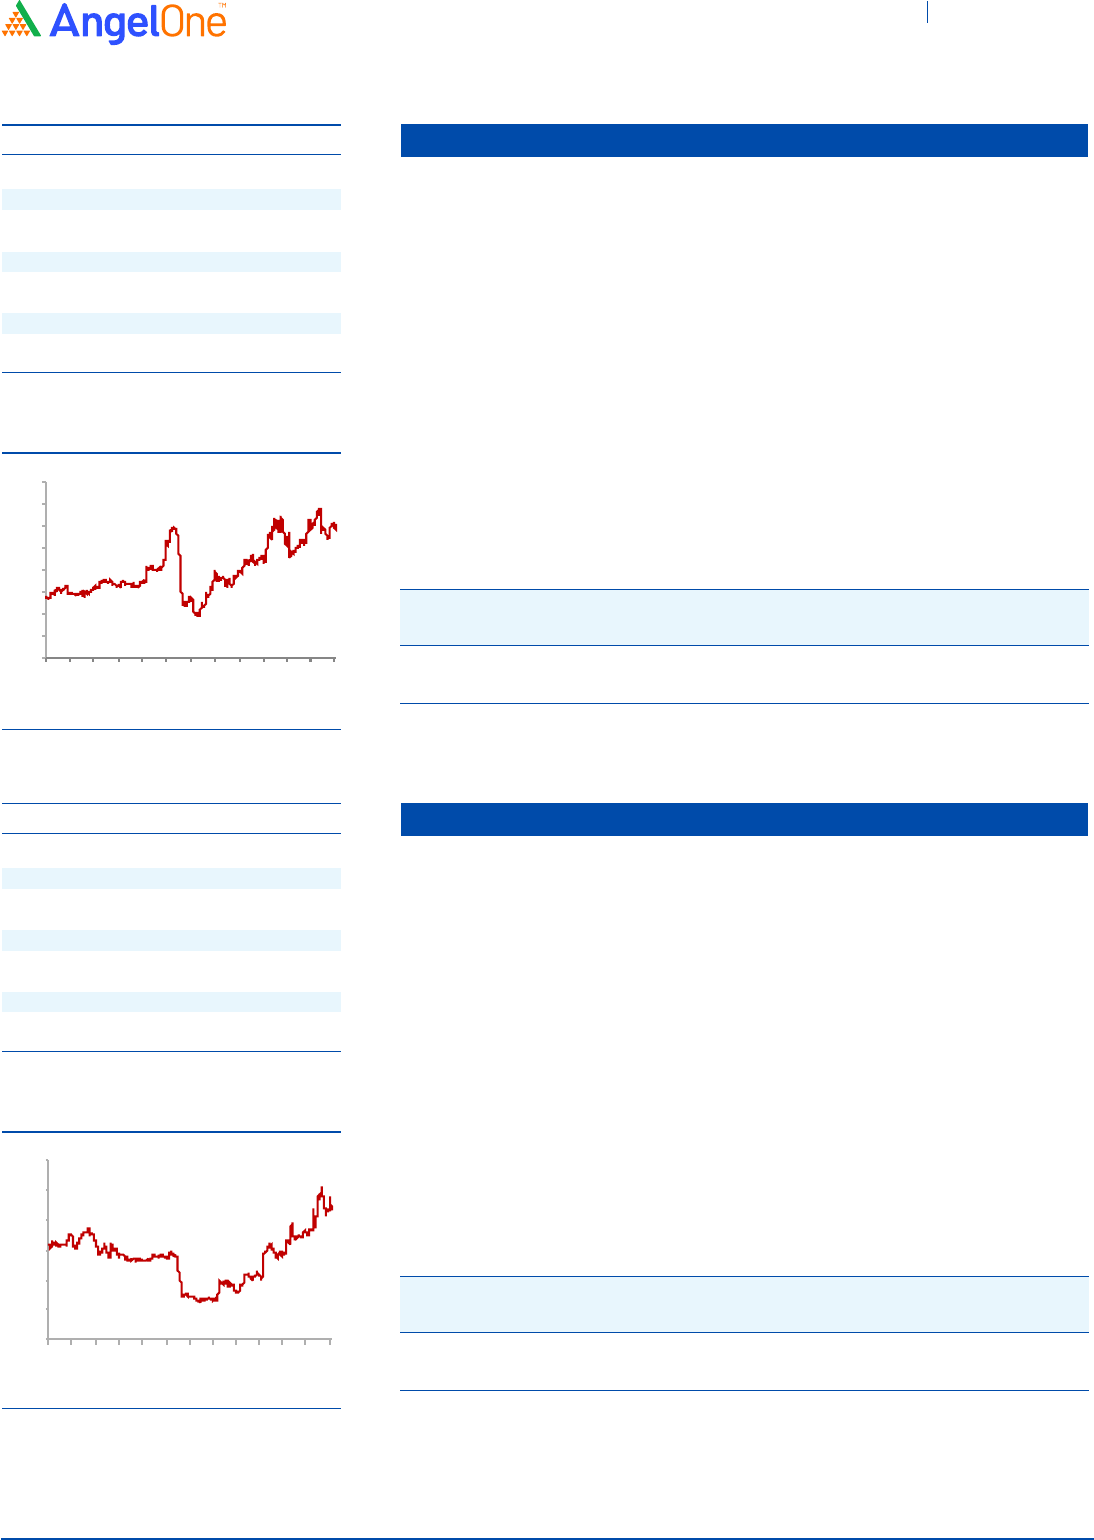
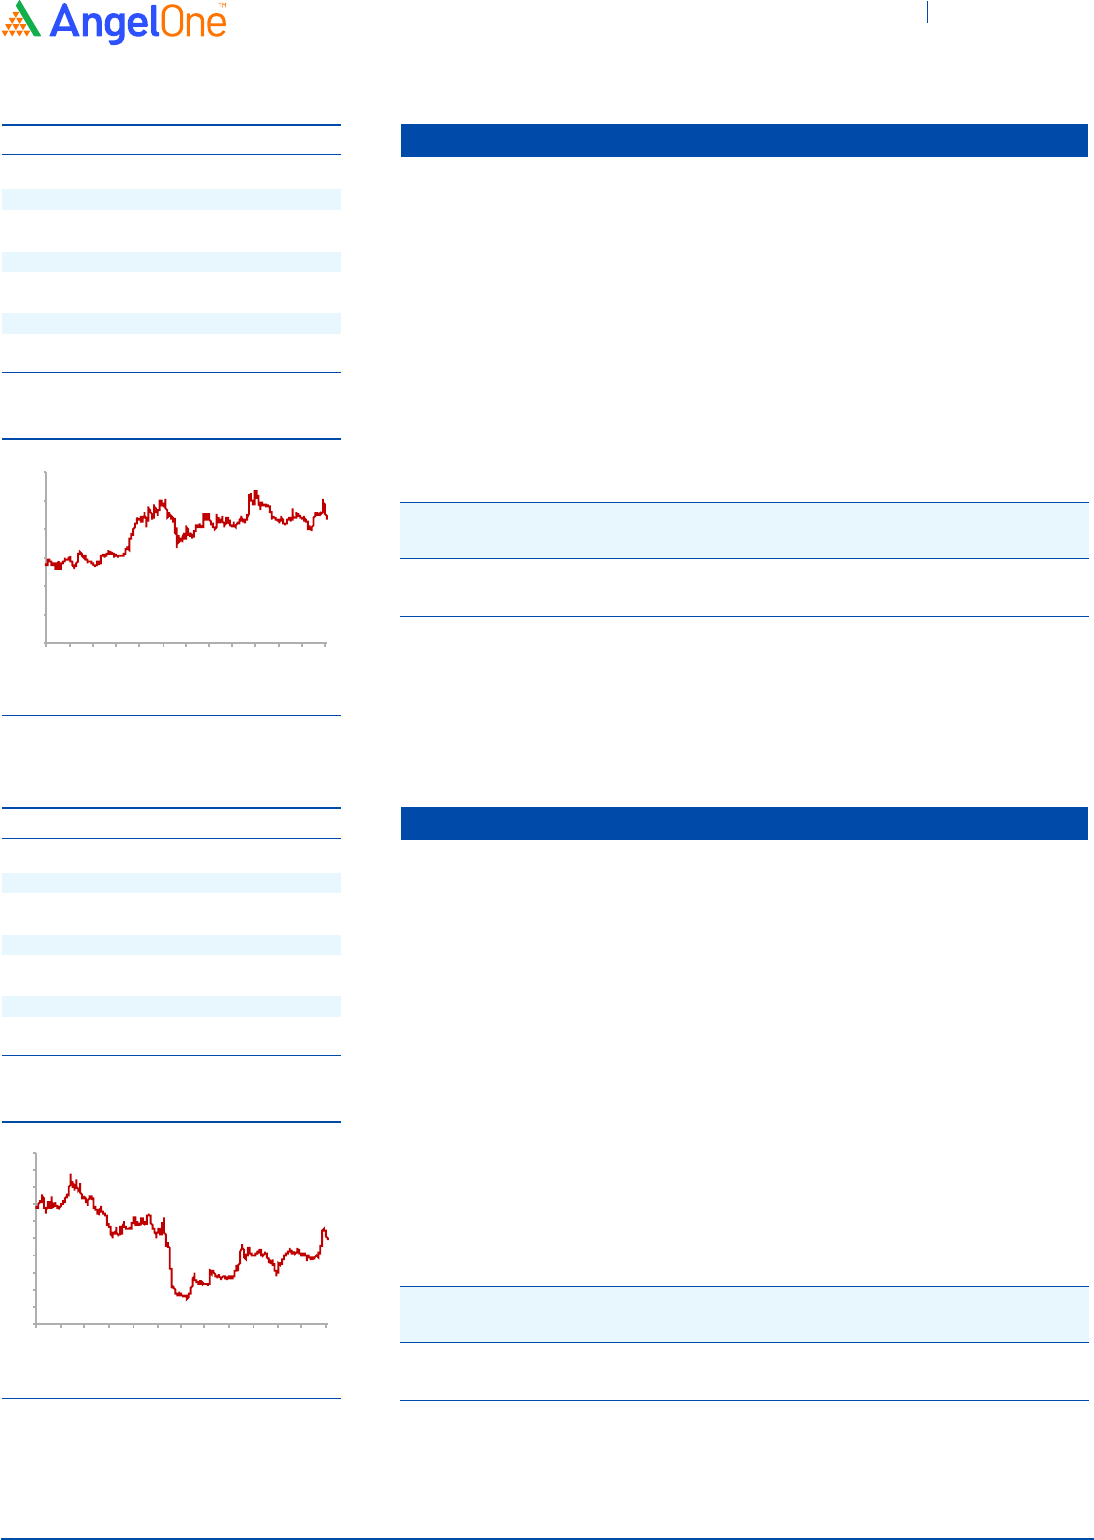
n Federal Bank is one of India's largest old generation private sector banks. At the end of
H2FY2022 the bank had total assets of ₹2.06 lakh Cr with deposits of ₹1.72 lakh Cr and a
loan book of ₹1.34 lakh Cr
n Federal Bank has posted a good set of numbers for Q2FY2022 as NII / advances
increased by 7.2%/9.5% YoY. Provisioning for the quarter was down by 58.6% YoY as a
result of which PAT was up by 49.6% YoY. GNPA and NNPA ratio improved to 3.25% and
1.12% while restructuring went up by ~75bps qoq to 2.6% of advances
n Overall asset quality for the quarter improved in Q2FY2022 which was better than our
expectations. We expect asset quality to improve further in H2FY2022 given continued
opening up of the economy. We expect the Federal bank to post NII/PPOP/PAT CAGR of
22.8%/23.7%/23.2% between FY2020-23 and remain positive on the bank
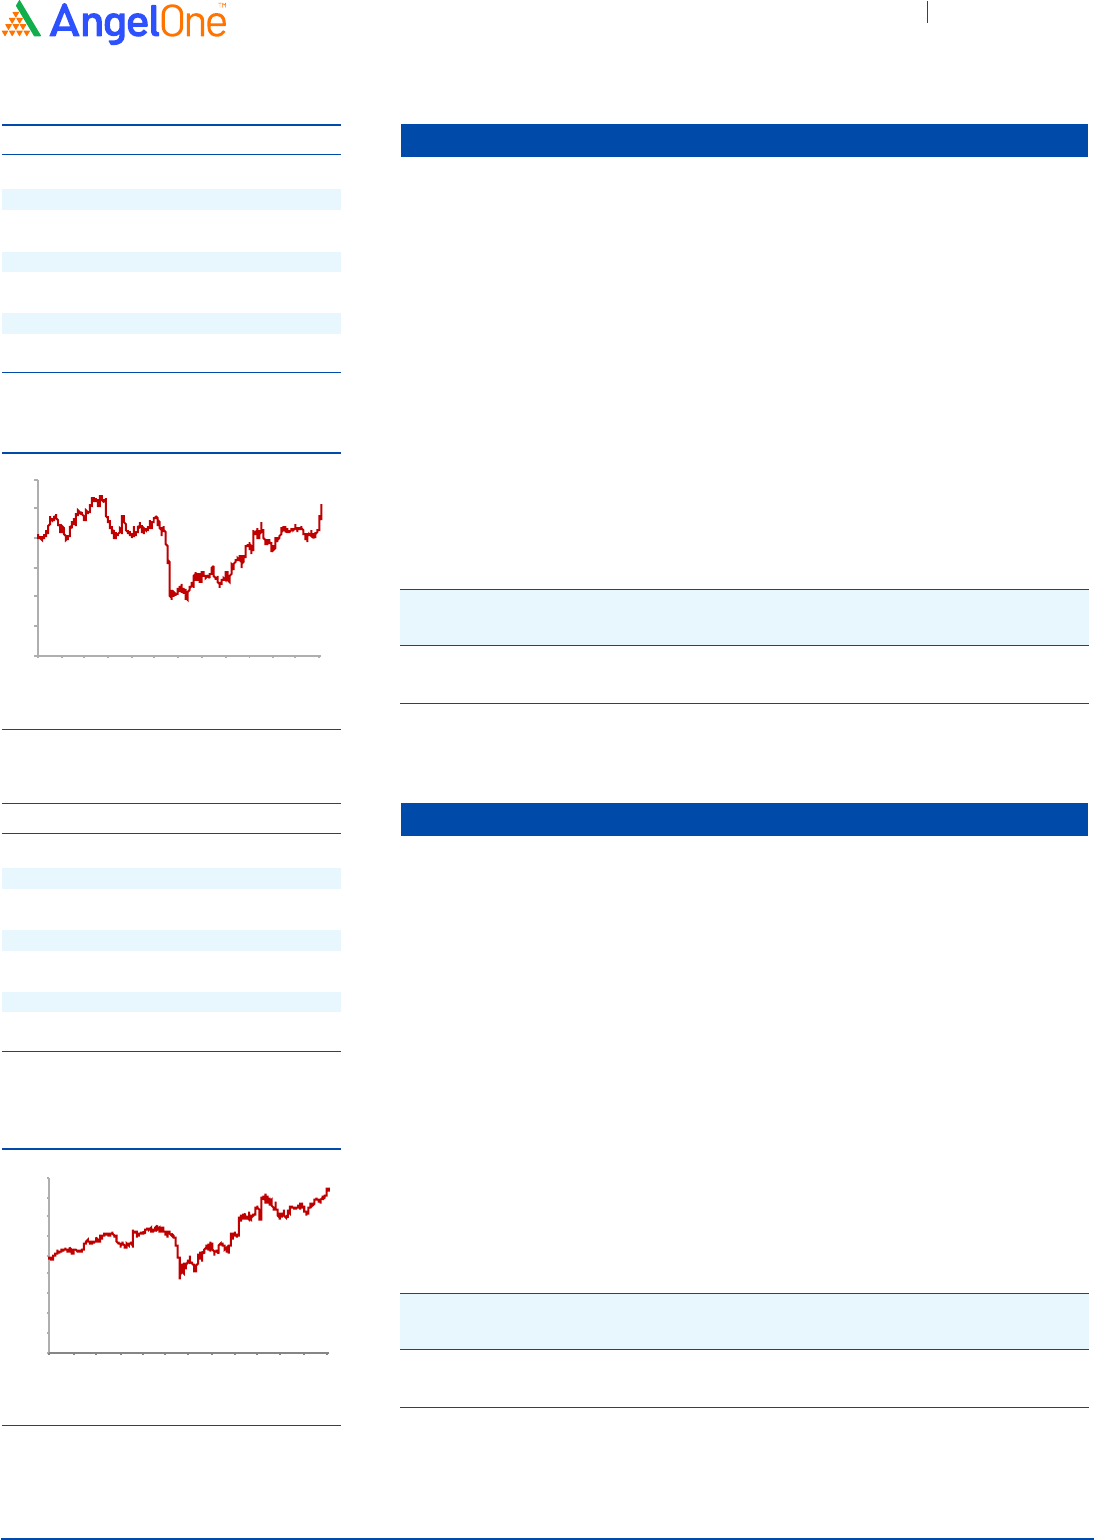
Federal Bank
3 year-Chart
Source: Company, Angel Research
Key Financials
Source: Company, Angel Research
Y/E NII NIM PAT EPS ABV ROA ROE P/E P/ABV
March (`cr) (%) (`cr) (`) (`) (%) (%) (x) (x)
FY2022E 6,604 3.1 2,107 10.6 84.3 1.0 12.3 9.6 1.2
FY2023E 8,612 3.4 2,884 14.5 97.7 1.1 14.7 7.0 1.1
-
20
40
60
80
100
120
Stock Info
CMP 1,653
TP 1,859
Upside 12%
Sector Banking
Market Cap (`cr) 9,31,372
Beta 1.2
52 Week High / Low 1,724/1,177
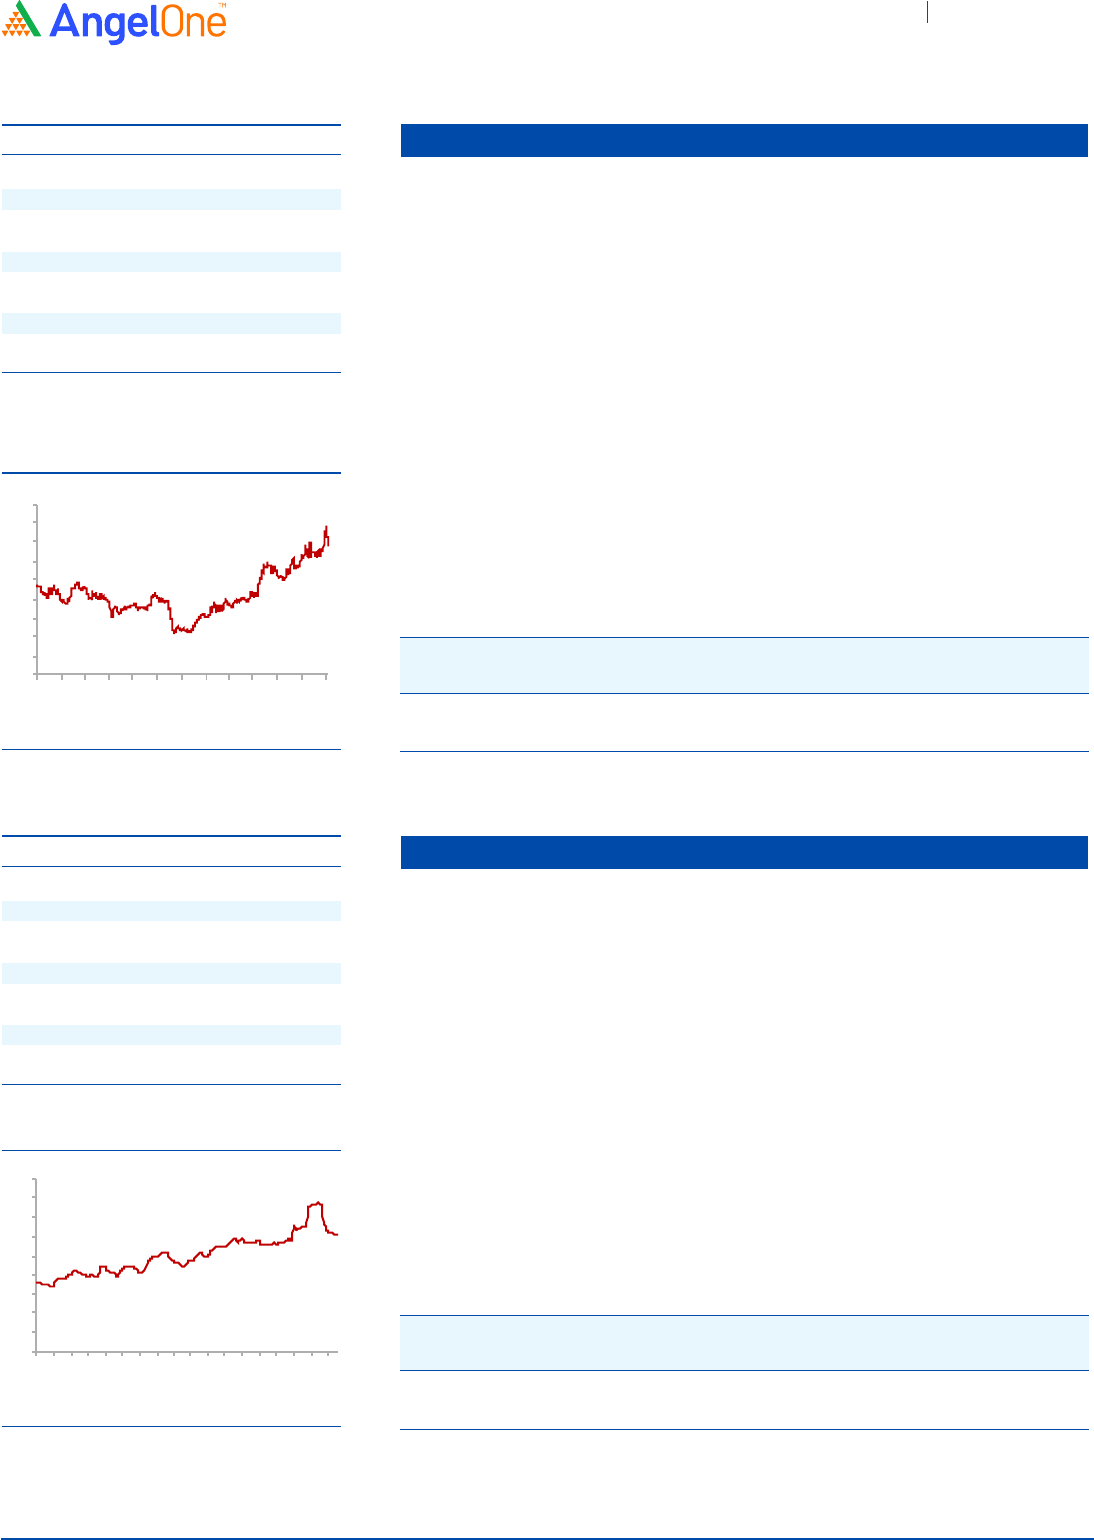
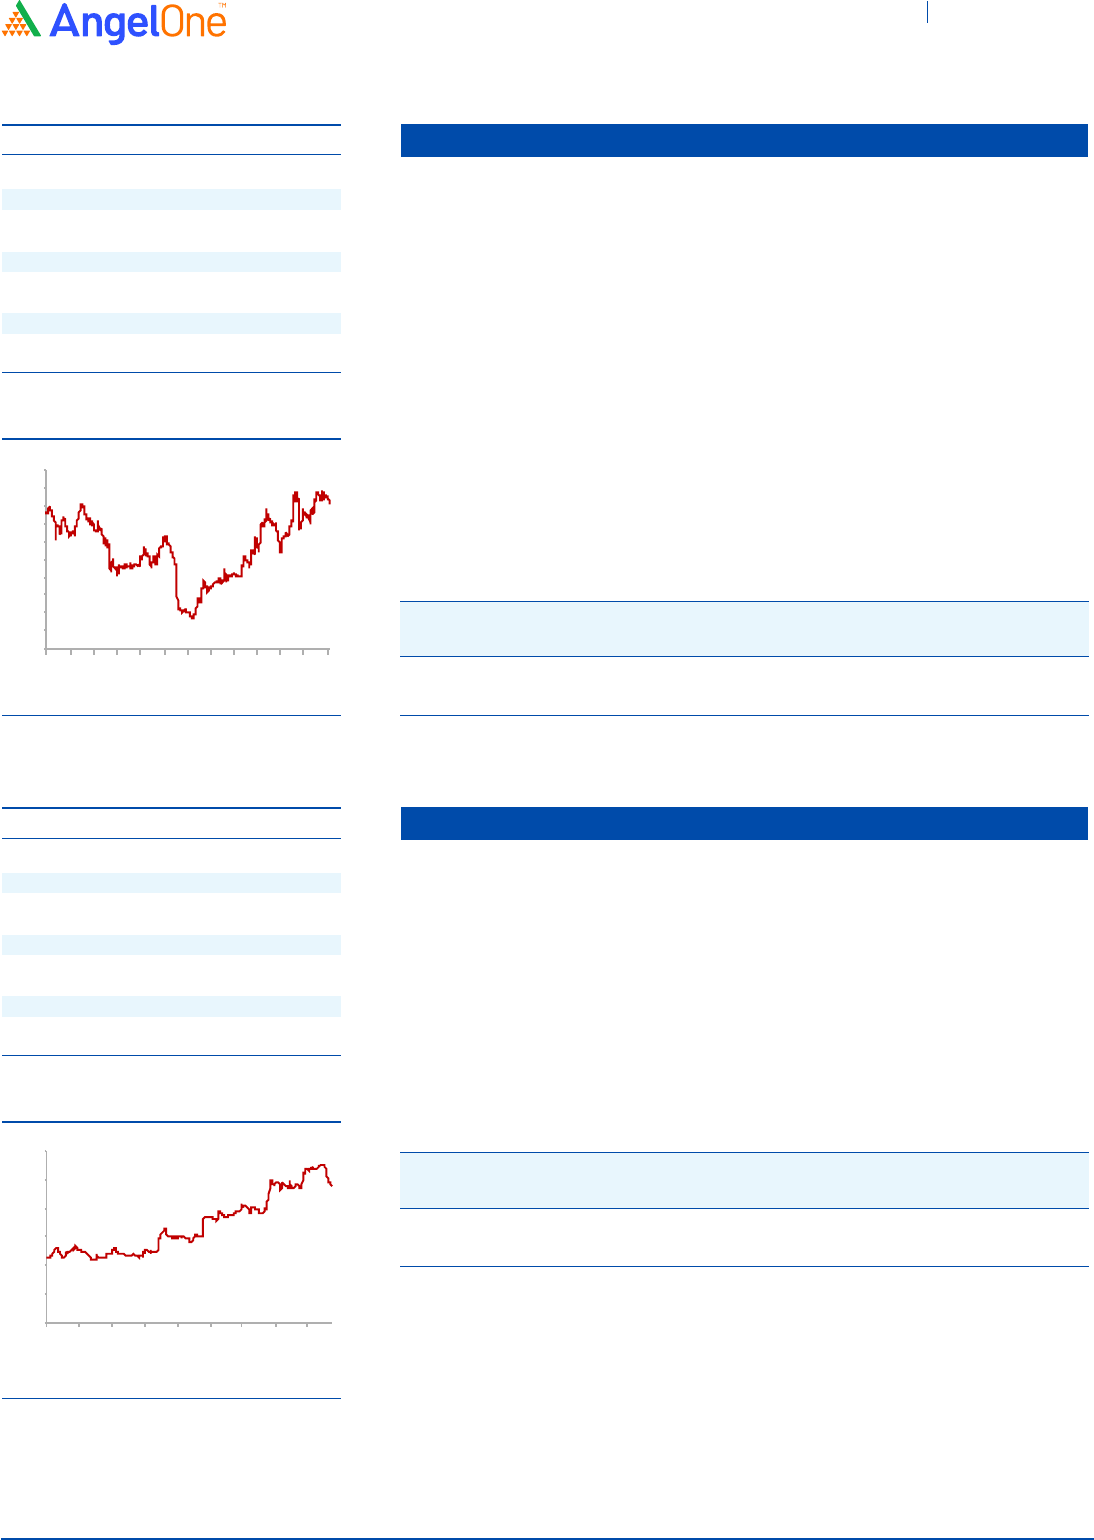
n HDFC Bank is India's largest private sector bank with a loan book of ₹12 lakh Cr in
H2FY2022 and deposit base of ₹14 lakh Cr. The bank has a very well spread-out book
with wholesale constituting ~54% of the asset book while retail accounted for the
remaining 46% of the loan book
n Q2FY2022 numbers were better than expected as GNPA/ NNPA reduced by 12/8bps
QoQ to 1.35% and 0.40% of advances. Restructured advances at the end of the quarter
stood at 1.5% of advances. The bank posted NII/PPOP/PAT growth of
12.5%/14.4%/17.6% for the quarter on the back of strong loan growth of 15.5% YoY.
NIMs for the quarter were stable sequentially at 4.1%
n The management has indicated that there will be maximum impact of 10-20bps on
asset quality from the restructured pool. Given best in class asset quality and expected
rebound in growth from H2FY2022 we are positive on the bank given reasonable
valuations at 3.2x FY23 adjusted book which is at a discount to historical averages
HDFC Bank
3 year-Chart
Source: Company, Angel Research
Key Financials
Source: Company, Angel Research
Y/E NII NIM PAT EPS ABV ROA ROE P/E P/ABV
March (`cr) (%) (`cr) (`) (`) (%) (%) (x) (x)
FY2022E 73,930 4.0 36,213 65.5 419 1.9 16.8 25.2 3.8
FY2023E 86,972 4.1 43,037 77.9 496 2.0 16.9 21.2 3.2
-
200
400
600
800
1,000
1,200
1,400
1,600
1,800
Nov-18
Jan-19
Apr-19
Jul-19
Oct-19
Jan-20
Apr-20
Jul-20
Oct-20
Jan-21
Apr-21
Jul-21
Oct-21
Nov-18
Jan-19
Apr-19
Jul-19
Oct-19
Jan-20
Apr-20
Jul-20
Oct-20
Jan-21
Apr-21
Jul-21
Oct-21
Top Picks Report November 2021
Diwali Special
November 2021 12
Stock Info
CMP 1,261
TP 1,520
Upside 20%
Sector Banking
Market Cap (`cr) 38,074
Beta 1.4
52 Week High / Low 1,389/722
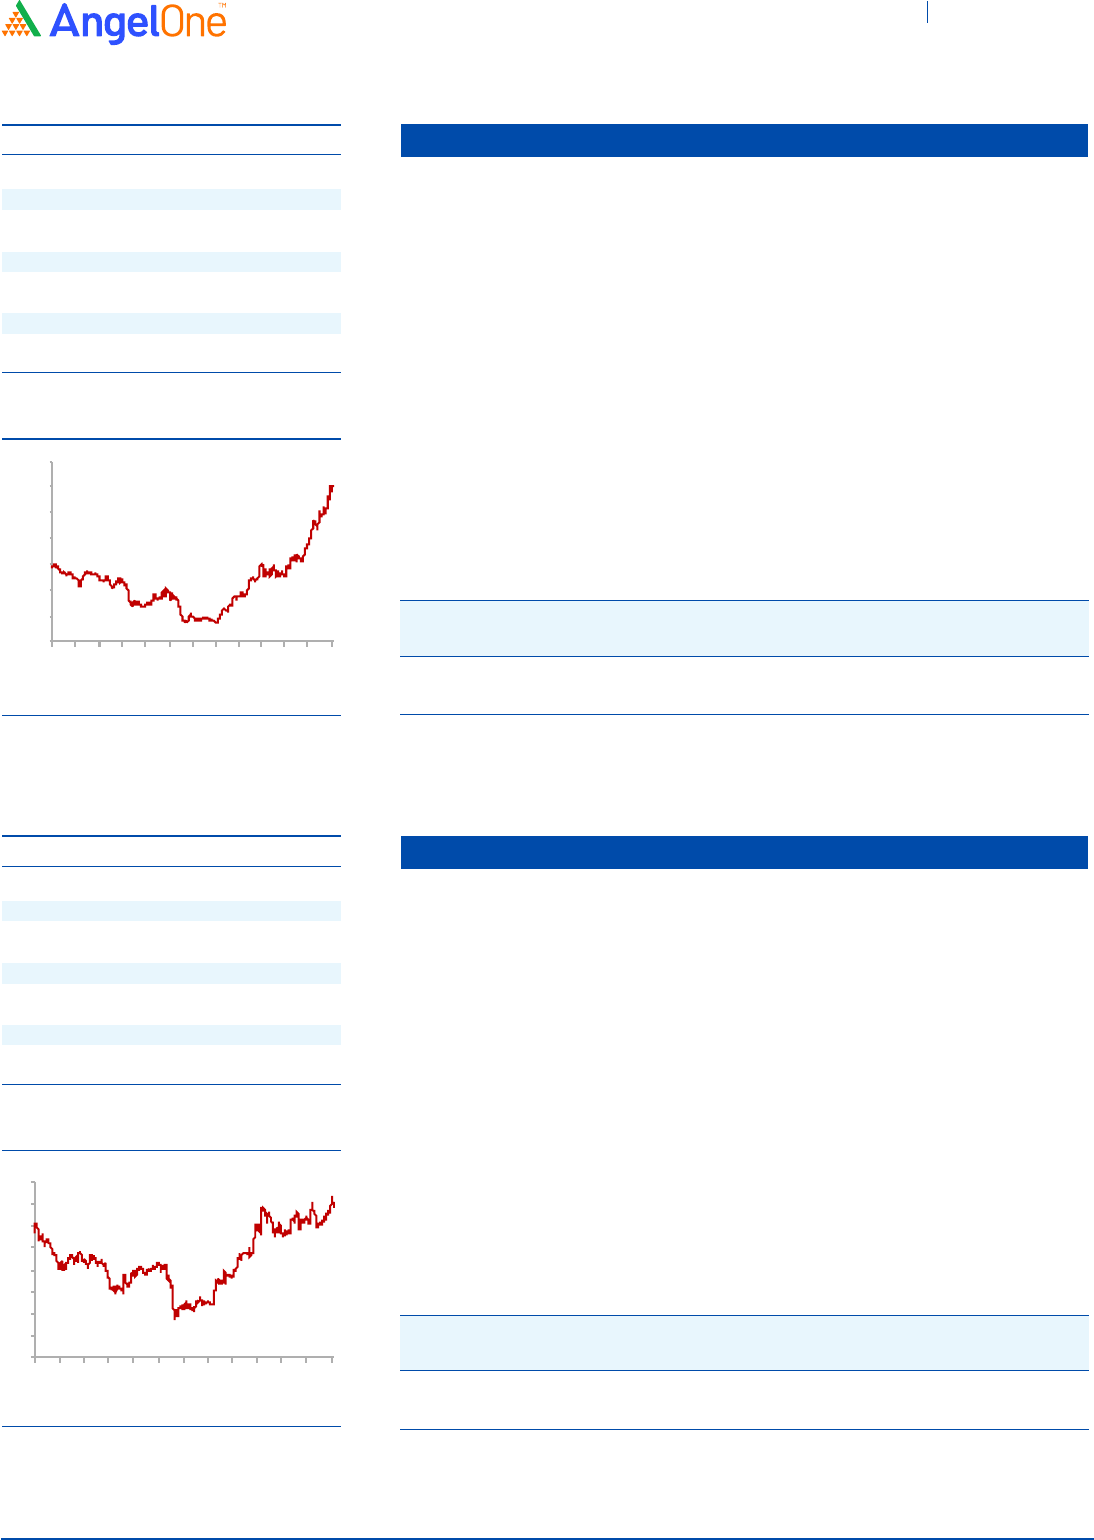
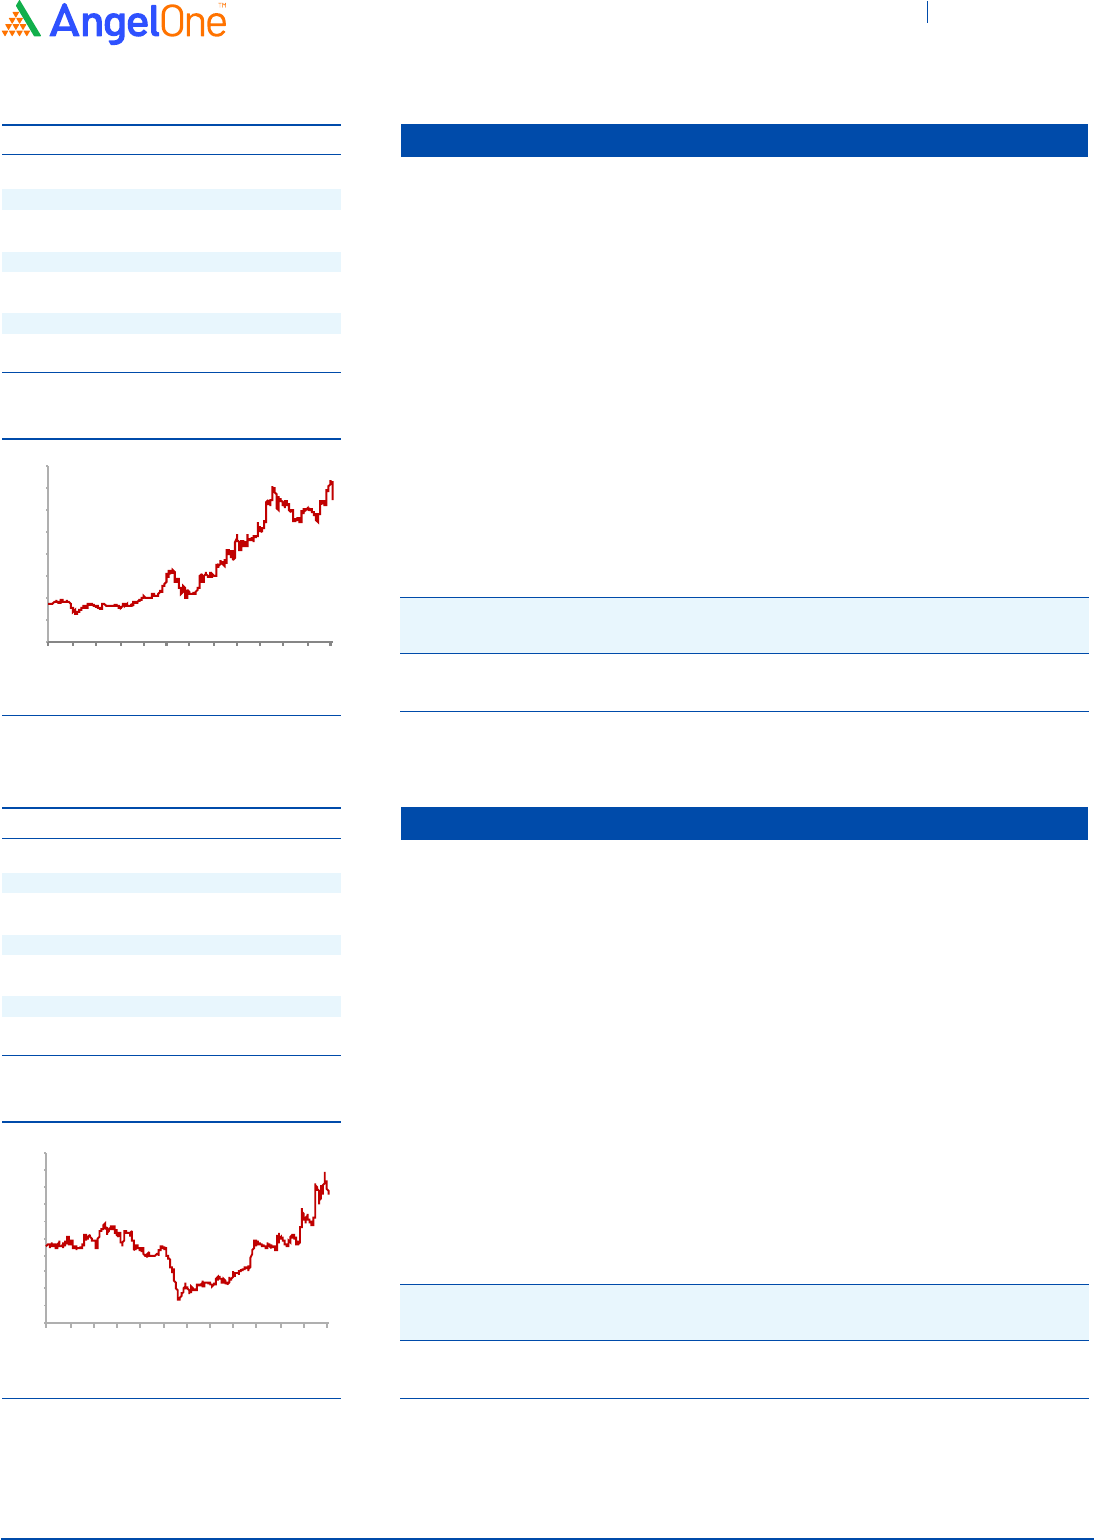
n AU Small Finance Bank is one of the leading small finance banks with AUM of ~₹34,688
Cr. at the end of Q1FY2022. It has a well-diversified geographical presence across India.
Wheels (auto) and SBL-MSME segment accounting for 37% and 39% of the
AUM respectively
n Collection efficiency remained strong during Jul/Aug/Sep at 110%/107%/109%. Given
stable asset quality, we expect loan growth to pick up in H2FY22 which should lead to a
rerating for the bank
n We expect AU SFB to post robust NII/PPOP/ PAT CAGR of 21.7%/25.1%/26.4% between
FY2020-23 on the back of AUM CAGR of 23.6%. Reducing cost of funds will also help
NIM expansion going forward. We believe that the worst is over for the bank in terms of
asset quality and expect significant improvement in asset quality in H2FY2022 which
should lead to a rerating
AU Small Finance
3 year-Chart
Source: Company, Angel Research
Key Financials
Source: Company, Angel Research
Y/E NII NIM PAT EPS ABV ROA ROE P/E P/ABV
March (`cr) (%) (`cr) (`) (`) (%) (%) (x) (x)
FY2022E 3,004 5.3 1,344 30.5 209.0 1.7 14.1 41.3 5.6
FY2023E 3,635 5.1 1,582 43.4 253.0 1.9 17.1 29.1 4.6
Stock Info
CMP 2,215
TP 3,002
Upside 35%
Sector Banking
Market Cap (`cr) 14,316
Beta 1.3
52 Week High / Low 2,600/766
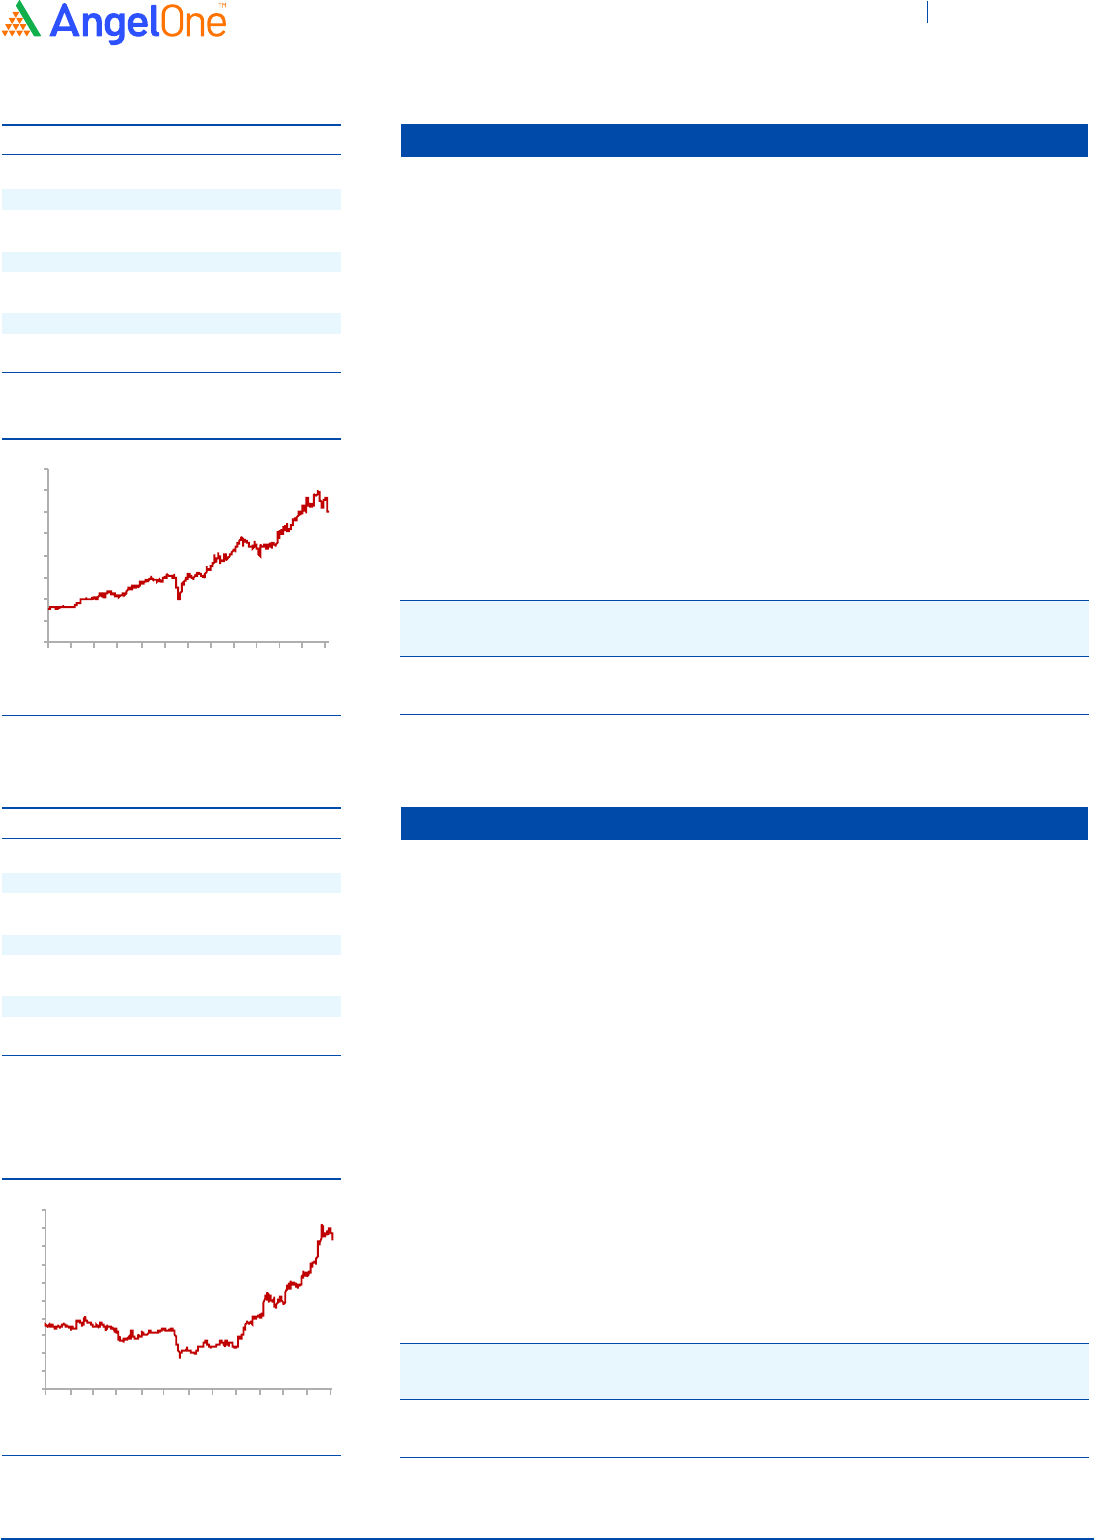
n Shriram City Union Finance is part of the shriram group and is in the high margin
business of lending to small businesses which account for 57.3% of the loan book as of
end FY2021. The company also provides auto, 2-wheeler, gold, and personal loans
n We expect Shriram City Union to post robust NII/PPOP/ PAT CAGR of
18.3%/19.0%/30.8% between FY2021-23 on the back of AUM CAGR of 14.5%. Reducing
cost of funds will also help NIM expansion going forward. We believe that asset quality
has held up well despite the covid crisis and expect significant improvement in asset
quality in H2FY2022
n We are positive on the company as we believe that the worst is over in terms of asset
quality which along with positive growth momentum should lead to a rerating for the
company
Shriram City Union
3 year-Chart
Source: Company, Angel Research
Key Financials
Source: Company, Angel Research
Y/E NII NIM PAT EPS ABV ROA ROE P/E P/ABV
March (`cr) (%) (`cr) (`) (`) (%) (%) (x) (x)
FY2022E 4,312 12.1 1,372 207.9 1,320.0 3.8 15.6 10.7 1.7
FY2023E 5,036 12.6 1,730 262.2 1,564.2 4.3 16.7 8.1 1.4
-
200
400
600
800
1,000
1,200
1,400
1,600
-
500
1,000
1,500
2,000
2,500
3,000
Nov-18
Jan-19
Apr-19
Jul-19
Oct-19
Jan-20
Apr-20
Jul-20
Oct-20
Jan-21
Apr-21
Jul-21
Oct-21
Nov-18
Jan-19
Apr-19
Jul-19
Oct-19
Jan-20
Apr-20
Jul-20
Oct-20
Jan-21
Apr-21
Jul-21
Oct-21
Top Picks Report November 2021
Diwali Special
November 2021 13
Stock Info
CMP 368
TP 425
Upside 15%
Sector Auto
Market Cap (`cr) 4,758
Beta 0.9
52 Week High / Low 399/175
n Suprajit Engineering (SEL), is the largest supplier of automotive cables to the domestic
OEMs with a presence across both 2Ws and PVs. Over the years, SEL has evolved from a
single product/client company in India to have a diversified exposure which coupled
with its proposition of low-cost player has enabled it to gain market share and more
business from existing customers
n SEL has outperformed the Indian Auto industry in recent years (posting positive
growth vs low double-digit declines for the domestic 2W and PV industry in FY21). The
company believes that consolidation of vendors and new client additions would help in
maintaining the trend of market/wallet share gains
n SEL has grown profitably over the years and as a result, it boasts a strong balance sheet
(net cash). We believe SEL is a prime beneficiary of a ramp-up in production by OEMs
across the globe and is well insulated from the threat of EV (is developing new
products). Its premium valuations are justified in our opinion owing to its strong
outlook and top-grade quality of earnings
Suprajit Engg.
3 year-Chart
Source: Company, Angel Research
Key Financials
Source: Company, Angel Research
Y/E Sales OPM PAT EPS ROE P/E P/BV EV/Sales
March (`cr) (%) (`cr) (`) (%) (x) (x) (x)
FY2022E 1,840 14.9 174 12.6 16.7 29.2 4.7 2.8
FY2023E 2,179 15.7 225 16.3 19.4 22.6 4.1 2.4
-
50
100
150
200
250
300
350
400
450
Stock Info
CMP 640
TP 775
Upside 21%
Sector Auto
Market Cap (`cr) 35,974
Beta 1.8
52 Week High / Low 813/295
n Sona BLW is one of India's leading automotive technology companies that derives
~40% of its revenues from Battery Electric Vehicles (BEV) and Hybrid Vehicles. It
supplies EV differential assemblies and gears, BSG systems, and EV traction motors to
global customers. This global BEV segment has been fastest growing and is expected
to maintain high growth rates which are positive for Sona BLW
n Sona BLW has a strong market share ranging from 55-90% for differential gears for PV,
CV, and tractor OEMs in India. The company's combined motor and driveline
capabilities have enabled them to gain market share across its products especially for
products related to EV/BEV
n Given the traction in the BEV/Hybrid Vehicle space, we believe that SonaComstar will
continue to command a higher multiple which is justified by ~49% earning CAGR over
FY21-24E
Sona BLW Precis.
4 Months-Chart
Source: Company, Angel Research
Key Financials
Source: Company, Angel Research
Y/E Sales OPM PAT EPS ROE P/E P/BV EV/Sales
March (`cr) (%) (`cr) (`) (%) (x) (x) (x)
FY2022E 2,171 26.9 335 5.7 23.0 111.3 23.1 17.3
FY2023E 2,997 28.3 500 8.6 28.3 74.7 19.5 12.6
-
100
200
300
400
500
600
700
800
900
Jun-21
Jul-21
Jul-21
Jul-21
Jul-21
Jul-21
Aug-21
Aug-21
Aug-21
Aug-21
Sep-21
Sep-21
Sep-21
Sep-21
Sep-21
Oct-21
Oct-21
Oct-21
Nov-18
Jan-19
Apr-19
Jul-19
Oct-19
Jan-20
Apr-20
Jul-20
Oct-20
Jan-21
Apr-21
Jul-21
Oct-21
Top Picks Report November 2021
Diwali Special
November 2021 14
Stock Info
CMP 1,192
TP 1,545
Upside 30%
Sector Auto
Market Cap (`cr) 3,846
Beta 0.9
52 Week High / Low 1,260/334
n Ramkrishna Forgings (RKFL), a leading forging player in India and among a select few
having heavy press stands to benefit from a favorable demand outlook for the Medium
& Heavy Commercial Vehicle (M&HCV) industry in domestic and export markets in the
near term
n The company has phased out its CAPEX over the past few years during which it was
impacted by industry slowdown in certain periods. With the end to the CAPEX cycle,
the favorable outlook in the medium term, and sufficient capacity in place, we believe
RKFL volumes would be able to post volume CAGR of 29% over FY21-23E
n RKFL has been able to add new products which have higher value addition. Better mix
along with operating leverage is expected to result in ~550 YoY bps EBITDA margin
improvement in FY22E
Ramkrishna Forg.
3 year-Chart
Source: Company, Angel Research
Key Financials
Source: Company, Angel Research
Y/E Sales OPM PAT EPS ROE P/E P/BV EV/Sales
March (`cr) (%) (`cr) (`) (%) (x) (x) (x)
FY2022E 2,213 23.5 203 63.4 18.6 18.8 3.5 2.2
FY2023E 2,595 23.9 266 83.0 14.7 14.4 2.9 1.8
Stock Info
CMP 143
TP 175
Upside 22%
Sector Auto
Market Cap (`cr) 40,819
Beta 1.5
52 Week High / Low 150/73
n The Ashok Leyland Ltd (ALL) is one of the leading players in the Indian CV industry with
a ~28% market share in the MHCV segment in FY21. The company also has a presence in
the fast-growing LCV segment where it is witnessing marker share gains.
n MHCV segment recovery was delayed due to the 2nd wave but opening up of the
economy along with improvement in business sentiment and increase in Government
spending on infrastructure is likely to boost MHCV demand. The bus segment is also
likely to bounce back going ahead owing to improvement in activities for the end-users
n FY21 MHCV industry production volumes have been at the lowest levels seen in ~12
years and we believe that the company is ideally placed to capture the growth revival in
the CV segment. We believe that ALL will be the biggest beneficiary of the
Government's voluntary scrappage policy and hence rate the stock a BUY.
Ashok Leyland Ltd.
3 year-Chart
Source: Company, Angel Research
Key Financials
Source: Company, Angel Research
Y/E Sales OPM PAT EPS ROE P/E P/BV EV/Sales
March (`cr) (%) (`cr) (`) (%) (x) (x) (x)
FY2022E 21,316 7.0 353 1.2 4.8 118.9 5.7 2.2
FY2023E 30,241 10.5 1,642 5.6 20.9 25.6 5.0 1.5
-
200
400
600
800
1,000
1,200
1,400
-
20
40
60
80
100
120
140
160
Nov-18
Jan-19
Apr-19
Jul-19
Oct-19
Jan-20
Apr-20
Jul-20
Oct-20
Jan-21
Apr-21
Jul-21
Oct-21
Nov-18
Jan-19
Apr-19
Jul-19
Oct-19
Jan-20
Apr-20
Jul-20
Oct-20
Jan-21
Apr-21
Jul-21
Oct-21
Top Picks Report November 2021
Diwali Special
November 2021 15
Stock Info
CMP 3,000
TP 3,950
Upside 32%
Sector AgroChemical
Market Cap (`cr) 45,998
Beta 0.9
52 Week High / Low 3,533/1,982
n PI Industries is a leading player in providing Custom synthesis and manufacturing
solutions (CSM) to global agrochemical players. The CSM business accounted for over
70% of the company's revenues in FY21 and is expected to be the key growth driver for
the company in future
n The company has been increasing its' share of high margin CSM business driven by
strong relationship with global agrochemical players. PI is leveraging its chemistry skill
sets and is looking to diversify its CSM portfolio to electronic chemicals, Pharma API,
fluoro chemicals, etc. which will help drive business
n PI Industries has announced that they will be acquiring the API business of Indswift labs
for a consideration of ₹1,500 Cr. Indswift labs had clocked revenues of ₹850 Cr in FY21
and provides PI with an entry into the API business which will help provide the company
with an additional lever to drive growth
P I Industries
3 year-Chart
Source: Company, Angel Research
Key Financials
Source: Company, Angel Research
Y/E Sales OPM PAT EPS ROE P/E P/BV EV/Sales
March (`cr) (%) (`cr) (`) (%) (x) (x) (x)
FY2022E 5,722 22.8 908 59.8 14.8 50.2 4.2 9.0
FY2023E 7,777 22.8 1,192 78.5 16.5 38.2 3.6 6.6
Stock Info
CMP 868
TP 1,010
Upside 16%
Sector Others
Market Cap (`cr) 16,036
Beta 0.7
52 Week High / Low 957/232
n Carborundum Universal (CUMI) is a leading manufacturer of abrasives, industrial
ceramics, refractories, and electro minerals (EMD) in India having application across
diversified user industries. CUMI is expected to benefit from improving demand
scenarios across its end-user industries such as auto, auto components, engineering,
basic metals, infrastructure, and power
n CUMI has shown good execution in recent quarters with a strong performance in
Abrasives and EMD segments. Within Abrasive, the company is gaining market share
(supply chain issues/preference for Indian suppliers) and should benefit from a good
end-user industry demand. EMD performance is likely to sustain owing to strong
pricing and Volumes (due to the China+1 strategy of its customers)
n Overseas operations have also improved and operations are expected to be at normal
levels. We believe that CUMI's leadership position in the domestic abrasives market,
well-diversified presence, launches of value-added products, and healthy cost
advantages would sustain the improvement in profitability and enhance cash
generation
Carborundum Universal
3 year-Chart
Source: Company, Angel Research
Key Financials
Source: Company, Angel Research
Y/E Sales OPM PAT EPS ROE P/E P/BV EV/Sales
March (``cr) (%) (`cr) (`) (%) (x) (x) (x)
FY2022E 3,167 18.0 380 20.0 16.6 43.3 6.7 4.9
FY2023E 3,667 17.9 444 23.5 16.9 37.0 5.9 4.2
-
500
1,000
1,500
2,000
2,500
3,000
3,500
4,000
-
100
200
300
400
500
600
700
800
900
1,000
Nov-18
Jan-19
Apr-19
Jul-19
Oct-19
Jan-20
Apr-20
Jul-20
Oct-20
Jan-21
Apr-21
Jul-21
Oct-21
Nov-18
Jan-19
Apr-19
Jul-19
Oct-19
Jan-20
Apr-20
Jul-20
Oct-20
Jan-21
Apr-21
Jul-21
Oct-21
Top Picks Report November 2021
Diwali Special
November 2021 16
Stock Info
CMP 2,230
TP 2,760
Upside 24%
Sector Others
Market Cap (`cr) 27,681
Beta 0.4
52 Week High / Low 2,777/1,970
n Whirlpool of India (WIL) is engaged in manufacturing and selling of Refrigerators,
Washing Machines, Air Conditioners, Microwave Ovens, built in and Small appliances
and caters to both domestic and international markets
n WIL's products are present in the categories with low penetration levels which in turn
can lead to higher growth for the company. WIL is increasing focus on emerging
categories like water purifier, AC and Kitchen Hoods & Hobs and the company is filling
product portfolio gap by launching products
n Going forward, we expect healthy profitability on back of strong brand, wide
distribution network, capacity expansion& strengthen product portfolio
Whirlpool India
3 year-Chart
Source: Company, Angel Research
Key Financials
Source: Company, Angel Research
Y/E Sales OPM PAT EPS ROE P/E P/BV EV/Sales
March (`cr) (%) (`cr) (`) (%) (x) (x) (x)
FY2022E 6,768 10.5 475 37.5 14.7 59.5 9.0 4.0
FY2023E 7,667 11.5 595 46.9 16.0 47.5 7.8 3.5
Stock Info
CMP 53
TP 64
Upside 21%
Sector Others
Market Cap (`cr) 4,056
Beta 0.9
52 Week High / Low 58/26
n Lemon Tree Hotels (LTH) is India's largest chain in the mid-priced hotels sector and
third largest overall. This award winning Indian hotel chain opened its first hotel with 49
rooms in May 2004 and operates 87 hotels in 54 destinations with ~8,500 rooms
n Company reported a 129.9% QoQ growth in revenues for Q2FY2022 to `96.9 Cr due to
sharp increase in occupancy levels to 51% from 29.6% in Q1FY2022, while ARR
increased by 28.2% QoQ. This led to a sharp increase of 120.6% in RevPAR sequentially.
As a result, the company posted an EBIDTA of `33.9 Cr for the quarter as compared to
an EBIDTA loss of `0.1Cr. for Q1FY2022
n Occupancy levels which had dropped to 20.0% in May due to the lockdowns have now
been stable at over 50% in Q2FY2022. We expect occupancy levels to improve further
from here on due to the ongoing festive season and improve further in FY2023 thus
driving revenue and profitability back to pre Covid levels in FY2023
Lemon Tree Hotel
3 year-Chart
Source: Company, Angel Research
Key Financials
Source: Company, Angel Research
Y/E Sales OPM PAT EPS ROE P/E P/BV EV/Sales
March (`cr) (%) (`cr) (`) (%) (x) (x) (x)
FY2022E 440 37.5 -90 -0.2 -10.8 - 4.2 11.8
FY2023E 705 45.0 11 0.0 1.3 - 4.1 7.5
-
500
1,000
1,500
2,000
2,500
3,000
-
10
20
30
40
50
60
70
80
90
100
Nov-18
Jan-19
Apr-19
Jul-19
Oct-19
Jan-20
Apr-20
Jul-20
Oct-20
Jan-21
Apr-21
Jul-21
Oct-21
Nov-18
Jan-19
Apr-19
Jul-19
Oct-19
Jan-20
Apr-20
Jul-20
Oct-20
Jan-21
Apr-21
Jul-21
Top Picks Report November 2021
Diwali Special
November 2021 17
Stock Info
CMP 853
TP 979
Upside 15%
Sector Others
Market Cap (`cr) 1,807
Beta 0.7
52 Week High / Low 900/401
n Safari Industries (India) Ltd (SIIL) is amongst the leading luggage players with market
share of ~18% market share in the organized sector. Market leader in mass segment &
shift from unorganized to organized sectors would benefit SIIL
n Over the last three years, the company has outperformed luggage Industries in terms
of sales growth. Company has a wide distribution network which would support growth
going ahead. Focused product strategy and diversified product portfolio to boost
growth
n Going forward, we expect SIIL to report strong top-line & Bottom-line growth on the
back of strong growth in the organized sector, wide distribution network, strong brand
& promoter initiatives
Safari Inds.
3 year-Chart
Source: Company, Angel Research
Key Financials
Source: Company, Angel Research
Y/E Sales OPM PAT EPS ROE P/E P/BV EV/Sales
March (`cr) (%) (`cr) (`) (%) (x) (x) (x)
FY2022E 494 7.0 10 4.7 5.6 180.3 10.0 4.0
FY2023E 815 10.0 44 20.1 19.7 42.5 8.2 2.4
Stock Info
CMP 980
TP 1,288
Upside 31%
Sector Others
Market Cap (`cr) 3,195
Beta 1.1
52 Week High / Low 1,135/400
n Stove Kraft Ltd (SKL) is engaged in the business of manufacturing & selling Kitchen &
Home appliances products like pressure cookers, LPG stoves, non-stick cookware
etc. under the brand name of 'Pigeon' and 'Gilma'
n In the Pressure Cookers and Cookware segment, over the last two years, the company
has outperformed Industry and its peers. Post Covid, organized players are gaining
market share from unorganized players which would benefit the player like SKL
n Going forward, we expect SKL to report healthy top-line & bottom-line growth on the
back of new product launches, strong brand name and wide distribution network
Stove Kraft
8-Months Chart
Source: Company, Angel Research
Key Financials
Source: Company, Angel Research
Y/E Sales OPM PAT EPS ROE P/E P/BV EV/Sales
March (`cr) (%) (`cr) (`) (%) (x) (x) (x)
FY2022E 1,057 10.6 68 21.1 18.6 46.4 8.6 4.7
FY2023E 1,248 11.4 94 29.0 20.4 33.8 6.9 3.5
-
100
200
300
400
500
600
700
800
900
1,000
-
200
400
600
800
1,000
1,200
Feb-21
Mar-21
Apr-21
May-21
Jun-21
Jul-21
Aug-21
Sep-21
Oct-21
Nov-18
Jan-19
Apr-19
Jul-19
Oct-19
Jan-20
Apr-20
Jul-20
Oct-20
Jan-21
Apr-21
Jul-21
Oct-21
Top Picks Report November 2021
Diwali Special
November 2021 18
Stock Info
CMP 3,450
TP 4,150
Upside 20%
Sector Others
Market Cap (`cr) 11,428
Beta 0.5
52 Week High / Low 3,788/2,081
n Amber Enterprises India Ltd. (Amber) is the market leader in the room air conditioners
(RAC) outsourced manufacturing space in India. Amber would outperform the industry
due to dominant position in Room AC contract manufacturing, increase in share of
business from existing customers and new client additions
n Amber plans to increase revenues from component business (by increasing product
offerings, catering to newer geographies, adding new clients) and exports (already
started in the Middle east). In the past 2–3-year, Amber has acquired companies like IL
JIN Electronics, Ever and Sidwal Refrigeration Industries, which would help in
backward integration and help the company to foray into different segments like
railway, metro and defense
n Going forward, we expect healthy profitability on the back of foray into the Commercial
AC segment, entry into export markets and, participation in the PLI scheme
Amber Enterp.
3 year-Chart
Source: Company, Angel Research
Key Financials
Source: Company, Angel Research
Y/E Sales OPM PAT EPS ROE P/E P/BV EV/Sales
March (`cr) (%) (`cr) (`) (%) (x) (x) (x)
FY2022E 4,004 7.1 150 45.4 8.6 76.0 6.3 2.7
FY2023E 5,620 8.6 262 78.9 13.1 43.7 5.5 2.0
Stock Info
CMP 765
TP 950
Upside 24%
Sector Others
Market Cap (`cr) 7,390
Beta 1.4
52 Week High / Low 900/240
n Company operates in Residential & Commercial real-estate along with Contractual
business. Companies 70% of residential pre-sales come from the Bangalore market
which is one of the IT hubs in India, we expect new hiring by the IT industry will increase
residential demand in the South India market
n Ready to move inventory and under construction inventory levels have moved down to
its lowest levels. Customers are now having preference towards the branded players
like Sobha Developers
n Company expected to launch 17 new projects/phase spread over 12.56mn sqft across
various geographies. Majority of launches will be coming from existing land banks.
Company having land bank of approx. 200mn Sqft of salable area
Sobha
3 year-Chart
Source: Company, Angel Research
Key Financials
Source: Company, Angel Research
Y/E Sales OPM PAT EPS ROE P/E P/BV EV/Sales
March (`cr) (%) (`cr) (`) (%) (x) (x) (x)
FY2022E 2,450 19.7 123 12.9 7.5 59.3 2.7 4.0
FY2023E 3,550 22.5 355 37.4 12.9 20.5 2.4 2.7
-
500
1,000
1,500
2,000
2,500
3,000
3,500
4,000
-
100
200
300
400
500
600
700
800
900
1,000
Nov-18
Jan-19
Apr-19
Jul-19
Oct-19
Jan-20
Apr-20
Jul-20
Oct-20
Jan-21
Apr-21
Jul-21
Oct-21
Nov-18
Jan-19
Apr-19
Jul-19
Oct-19
Jan-20
Apr-20
Jul-20
Oct-20
Jan-21
Apr-21
Jul-21
Oct-21
Top Picks Report November 2021
Diwali Special
November 2021 19

Stock bought in last 6 Months
Stock Name Date Reco Price
Godrej Propert. 4-Jun-21 BUY 1,420
SuprajitEngg. 8-Jun-21 BUY 288
L & T Infotech 11-Jun-21 BUY 4,060
Jindal Steel 14-Jun-21 BUY 420
Quess Corp 16-Jun-21 BUY 840
Stove Kraft 21-Jun-21 BUY 578
Galaxy Surfact. 7-Jul-21 BUY 3,135
AU Small Finance 9-Jul-21 BUY 1,148
DalmiaBharatLtd 15-Jul-21 BUY 2,218
Safari Inds. 19-Jul-21 BUY 742
HDFC Bank 5-Aug-21 BUY 1,490
Sona BLW Precis. 25-Aug-21 BUY 484
Bajaj Electrical 27-Aug-21 BUY 1,189
Sobha 31-Aug-21 BUY 627
P I Industries 9-Sep-21 BUY 3,420
Amber Enterp. 14-Sep-21 BUY 3,243
Sobha 22-Sep-21 BUY 729
Lemon Tree Hotel 23-Sep-21 BUY 43.25
Whirlpool India 29-Sep-21 BUY 2,299
RamkrishnaForg. 13-Oct-21 BUY 1,220
Source: Company, Angel Research
Stock sold in last 6 Month
Stock Name Date Reco Price
NRB Bearings 8-Jun-21 EXIT 131.600
Galaxy Surfact. 15-Jun-21 EXIT 3,086
LIC Housing Fin. 16-Jun-21 EXIT 497
PVR 29-Jun-21 EXIT 1,355
Quess Corp 15-Jul-21 EXIT 751
Apollo Hospitals 27-Jul-21 EXIT 4,100
IDFC First Bank 5-Aug-21 EXIT 47
Galaxy Surfact. 18-Aug-21 EXIT 2,997
Jindal Steel 23-Aug-21 EXIT 362
Godrej Propert. 25-Aug-21 EXIT 1,437
Escorts 31-Aug-21 EXIT 1,348
Sobha 7-Sep-21 EXIT 780
Crompton Gr. Con 14-Sep-21 EXIT 484
DalmiaBharatLtd 22-Sep-21 EXIT 2,143
Bajaj Electrical 24-Sep-21 EXIT 1,499
L & T Infotech 27-Sep-21 EXIT 5,950
GNA Axles 19-Oct-21 EXIT 1,076
Source: Company, Angel Research
Top Picks Report November 2021
Diwali Special
November 2021
20

Research Team Tel: 022 - 39357800 E-mail: [email protected] Website: www.angelone.in
DISCLAIMER
Angel One Limited (formerly known as Angel Broking Limited) is a registered Member of National Stock Exchange of India Limited, Bombay Stock
Exchange Limited, Metropolitan Stock Exchange Limited, Multi Commodity Exchange of India Ltd and National Commodity & Derivatives
Exchange Ltd It is also registered as a Depository Participant with CDSL and Portfolio Manager and Investment Adviser with SEBI. It also has
registration with AMFI as a Mutual Fund Distributor. Angel One Limited is a registered entity with SEBI for Research Analyst in terms of SEBI
(Research Analyst) Regulations, 2014 vide registration number INH000000164. Angel or its associates has not been debarred/ suspended by
SEBI or any other regulatory authority for accessing /dealing in securities Market. Angel or its associates/analyst has not received any
compensation / managed or co-managed public offering of securities of the company covered by Analyst during the past twelve months.
This document is solely for the personal information of the recipient, and must not be singularly used as the basis of any investment decision.
Nothing in this document should be construed as investment or financial advice. Each recipient of this document should make such
investigations as they deem necessary to arrive at an independent evaluation of an investment in the securities of the companies referred to in
this document (including the merits and risks involved), and should consult their own advisors to determine the merits and risks of such an
investment.
Reports based on technical and derivative analysis center on studying charts of a stock's price movement, outstanding positions and trading
volume, as opposed to focusing on a company's fundamentals and, as such, may not match with a report on a company's fundamentals. Investors
are advised to refer the Fundamental and Technical Research Reports available on our website to evaluate the contrary view, if any.
The information in this document has been printed on the basis of publicly available information, internal data and other reliable sources
believed to be true, but we do not represent that it is accurate or complete and it should not be relied on as such, as this document is for general
guidance only. Angel One Limited or any of its affiliates/ group companies shall not be in any way responsible for any loss or damage that may
arise to any person from any inadvertent error in the information contained in this report. Angel One Limited has not independently verified all
the information contained within this document. Accordingly, we cannot testify, nor make any representation or warranty, express or implied, to
the accuracy, contents or data contained within this document. While Angel One Limited endeavors to update on a reasonable basis the
information discussed in this material, there may be regulatory, compliance, or other reasons that prevent us from doing so.
This document is being supplied to you solely for your information, and its contents, information or data may not be reproduced, redistributed or
passed on, directly or indirectly.
Neither Angel One Limited, nor its directors, employees or affiliates shall be liable for any loss or damage that may arise from or in connection
with the use of this information.
Ratings (Based on expected returns Buy (> 15%) Accumulate (5% to 15%) Neutral (-5 to 5%)
over 12 months investment period): Reduce (-5% to -15%) Sell (< -15%)
Hold (Fresh purchase not recommended)
Disclosure of Interest Statement Top Picks
1. Financial interest of research analyst or Angel or his Associate or his relative No
2. Ownership of 1% or more of the stock by research analyst or Angel or associates or relatives No
3. Served as an officer, director or employee of the company covered under Research No
4. Broking relationship with company covered under Research No
Top Picks Report November 2021
Diwali Special
November 2021 21

6th Floor, Ackruti Star, Central Road, MIDC, Andheri(E), Mumbai - 400 093. Tel: (022) 39357800
Research Team
Fundamental:
Amarjeet Maurya Senior Lead Analyst [email protected]
Angel One Limited (formerly known as Angel Broking Limited), Registered Office: G-1, Ackruti Trade Center, Road No. 7, MIDC, Andheri (E),
Mumbai - 400 093. Tel: (022) 6807 0100.Fax: (022) 6807 0107, CIN: L67120MH1996PLC101709, SEBI Regn. No.: INZ000161534-BSE Cash/F&O/CD
(Member ID: 612), NSE Cash/F&O/CD (Member ID: 12798), MSEI Cash/F&O/CD (Member ID: 10500), MCX Commodity Derivatives (Member ID:
12685) and NCDEX Commodity Derivatives (Member ID: 220), CDSL Regn. No.: IN-DP-384-2018, PMS Regn. No.: INP000001546, Research Analyst
SEBI Regn. No.: INH000000164, Investment Adviser SEBI Regn. No.: INA000008172, AMFI Regn. No.: ARN–77404, PFRDA Registration
No.19092018.Compliance officer: Ms. Richa Ghosh, Tel: (022) 39413940 Email: [email protected]
Technical and Derivatives:
